Post History
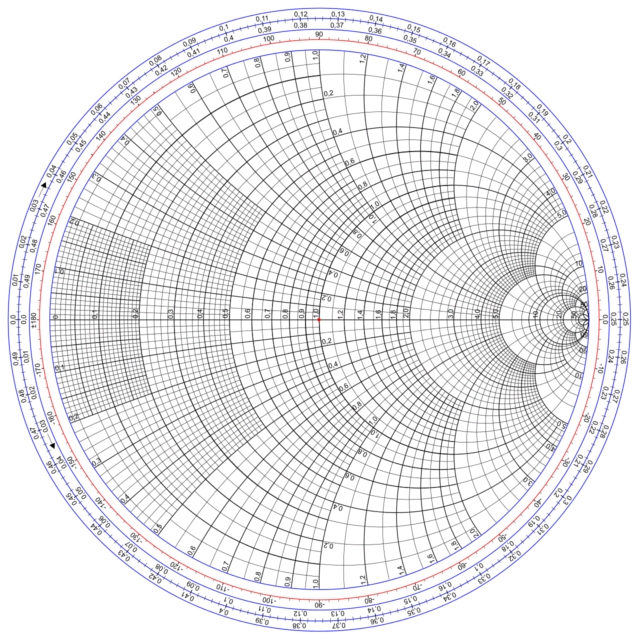
As an alternative to doing the math, as detailed in Andy's answer, you can use a graphical aid called a Smith chart: These were used routinely before computers to match transmitters to antennas. ...
#2: Post edited
by
 Olin Lathrop
·
2020-06-25T12:32:39Z (almost 5 years ago)
Olin Lathrop
·
2020-06-25T12:32:39Z (almost 5 years ago)
As an alternative to doing the math, as detailed in Andy's answer, you can use a graphical aid called a <i>Smith chart</i>:These were used routinely before computers to match transmitters to antennas. The math behind them is what Andy described. See the <a href="https://en.wikipedia.org/wiki/Smith_chart">Wikipedia page</a> for details, which is where the image above was copied from.
- As an alternative to doing the math, as detailed in Andy's answer, you can use a graphical aid called a Smith chart:
- 
- These were used routinely before computers to match transmitters to antennas. The math behind them is what Andy described. See the <a href="https://en.wikipedia.org/wiki/Smith_chart">Wikipedia page</a> for details, which is where the image above was copied from.
#1: Initial revision
by
Olin Lathrop
·
2020-06-24T11:58:32Z (almost 5 years ago)
As an alternative to doing the math, as detailed in Andy's answer, you can use a graphical aid called a <i>Smith chart</i>:  These were used routinely before computers to match transmitters to antennas. The math behind them is what Andy described. See the <a href="https://en.wikipedia.org/wiki/Smith_chart">Wikipedia page</a> for details, which is where the image above was copied from.