Post History
Which graph on the picture above better represents real-world use-case? They both represent real-world use cases. The impedance graph informs you how much ESL (effective series inductance) the...
#3: Post edited
by
 Andy aka
·
2021-05-08T16:04:58Z (about 4 years ago)
Andy aka
·
2021-05-08T16:04:58Z (about 4 years ago)
- > _Which graph on the picture above better represents real-world use-case?_
They both represent real-world uses cases. The impedance graph informs you how much ESL (effective series inductance) the capacitor has and, at the series resonance point you can evaluate the ESL value with a simple formula: -- 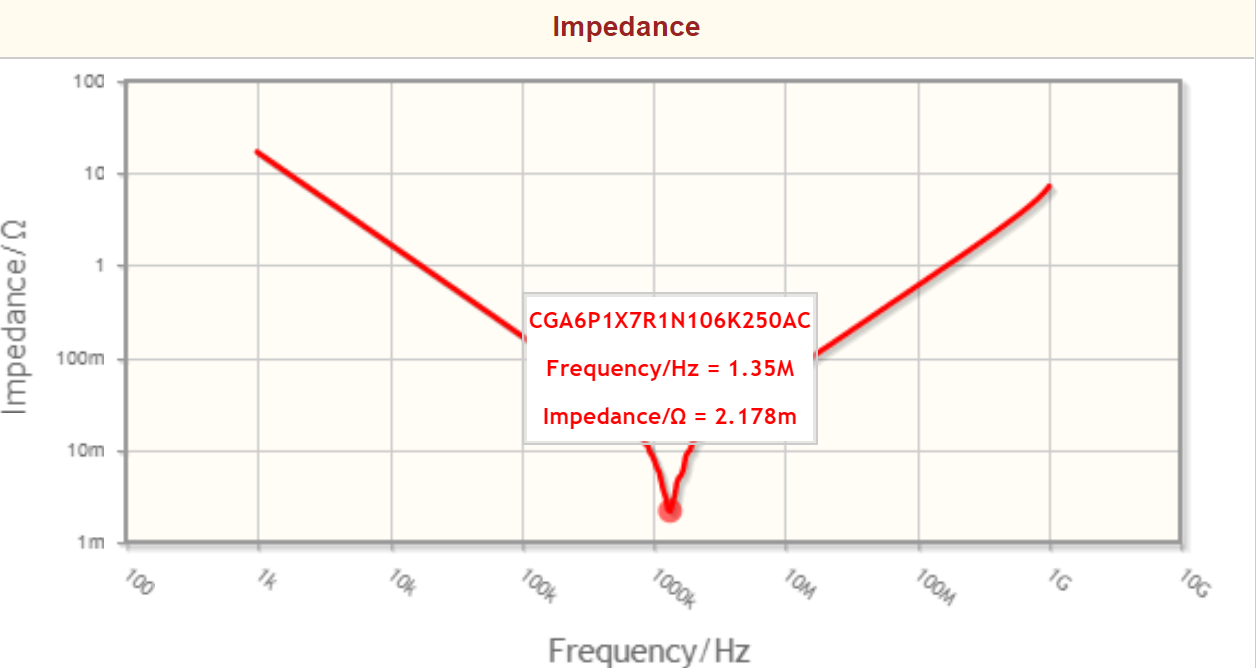
- Resonance occurs at 1.35 MHz and, if you know the capacitance value, you can derive ESL. Note also that at 1.35 MHz, the ESR value is very similar: -
- 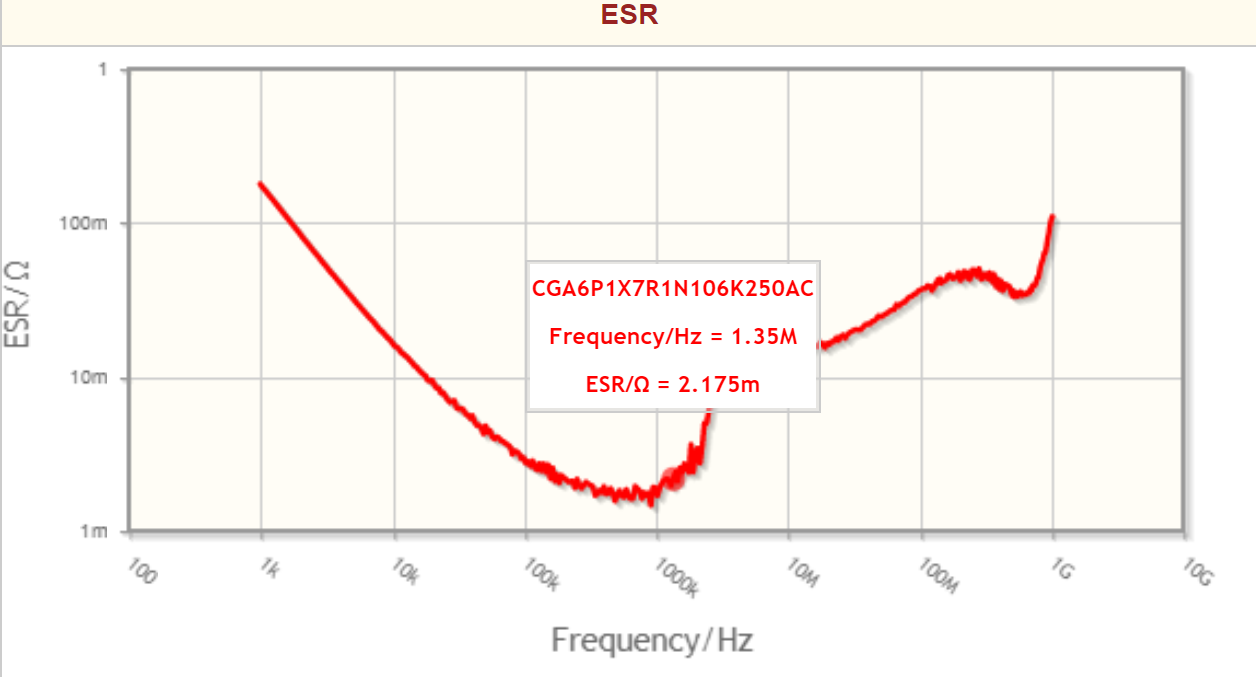
- In other words, at resonance you can also determine the ESR.
- > _What is the point of specifying the ESR solely for AC loads?_
If you mean what is the point of showing a graph of ESR at various frequencies, then the graph is very informative. ESR represents the effective losses of the capacitor at each frequency (that's dielectric and true series resistance losses) as one resistor called *the effective series resistance*. So, given that you know the true series resistance (~2.175 mΩ), you can calculate the dielectric losses at other non-resonant frequencies and get a bigger picture of how the capacitor performs at all frequencies.
- > _Which graph on the picture above better represents real-world use-case?_
- They both represent real-world use cases. The impedance graph informs you how much ESL (effective series inductance) the capacitor has and, at the series resonance point you can evaluate the ESL value with a simple formula: -
- 
- Resonance occurs at 1.35 MHz and, if you know the capacitance value, you can derive ESL. Note also that at 1.35 MHz, the ESR value is very similar: -
- 
- In other words, at resonance you can also determine the ESR.
- The impedance graph also shows what you would expect from your capacitor at frequencies below resonance. At 10 kHz (for instance) the impedance is maybe 2 Ω and, if you calculate the capacitance you get a value of around 8 μF. So, I'm guessing that these graphs are for a 10 μF capacitor. At 1 kHz the impedance is ten times higher as you'd expect from a capacitor. At 100 kHz, the impedance is ten times lower.
- But, go beyond 100 kHz a little and you are hitting the effects produced by ESL series resonance.
- > _What is the point of specifying the ESR solely for AC loads?_
- If you mean what is the point of showing a graph of ESR at various frequencies, then the graph is very informative. ESR represents the effective losses of the capacitor at each frequency (that's dielectric and true series resistance losses) as one resistor called *the effective series resistance*.
- So, given that you know the minimum ESR, you can calculate the dielectric losses at other frequencies and get a bigger picture of how the capacitor performs across the spectrum.
#2: Post edited
by
Andy aka
·
2021-05-08T14:11:02Z (about 4 years ago)
- > _Which graph on the picture above better represents real-world use-case?_
They both represent real-world uses cases. The impedance graph informs you how much ESL (effective series inductance) the capacitor has and at series resonance you can calculate the ESL: -- 
- Resonance occurs at 1.35 MHz and, if you know the capacitance value, you can derive ESL. Note also that at 1.35 MHz, the ESR value is very similar: -
- 
- In other words, at resonance you can also determine the ESR.
- > _What is the point of specifying the ESR solely for AC loads?_
- If you mean what is the point of showing a graph of ESR at various frequencies, then the graph is very informative. ESR represents the effective losses of the capacitor at each frequency (that's dielectric and true series resistance losses) as one resistor called *the effective series resistance*. So, given that you know the true series resistance (~2.175 mΩ), you can calculate the dielectric losses at other non-resonant frequencies and get a bigger picture of how the capacitor performs at all frequencies.
- > _Which graph on the picture above better represents real-world use-case?_
- They both represent real-world uses cases. The impedance graph informs you how much ESL (effective series inductance) the capacitor has and, at the series resonance point you can evaluate the ESL value with a simple formula: -
- 
- Resonance occurs at 1.35 MHz and, if you know the capacitance value, you can derive ESL. Note also that at 1.35 MHz, the ESR value is very similar: -
- 
- In other words, at resonance you can also determine the ESR.
- > _What is the point of specifying the ESR solely for AC loads?_
- If you mean what is the point of showing a graph of ESR at various frequencies, then the graph is very informative. ESR represents the effective losses of the capacitor at each frequency (that's dielectric and true series resistance losses) as one resistor called *the effective series resistance*. So, given that you know the true series resistance (~2.175 mΩ), you can calculate the dielectric losses at other non-resonant frequencies and get a bigger picture of how the capacitor performs at all frequencies.
#1: Initial revision
by
Andy aka
·
2021-05-08T14:09:50Z (about 4 years ago)
> _Which graph on the picture above better represents real-world use-case?_ They both represent real-world uses cases. The impedance graph informs you how much ESL (effective series inductance) the capacitor has and at series resonance you can calculate the ESL: -  Resonance occurs at 1.35 MHz and, if you know the capacitance value, you can derive ESL. Note also that at 1.35 MHz, the ESR value is very similar: -  In other words, at resonance you can also determine the ESR. > _What is the point of specifying the ESR solely for AC loads?_ If you mean what is the point of showing a graph of ESR at various frequencies, then the graph is very informative. ESR represents the effective losses of the capacitor at each frequency (that's dielectric and true series resistance losses) as one resistor called *the effective series resistance*. So, given that you know the true series resistance (~2.175 mΩ), you can calculate the dielectric losses at other non-resonant frequencies and get a bigger picture of how the capacitor performs at all frequencies.