Post History
If a data sheet gives the thermal noise (of +3/-3 standard deviations) as 1 uVpp does it mean that out of every thousand samples, 3 will have noise more than ±1 uV at any sample rate? 1000 sps wi...
#2: Post edited
- > If a data sheet gives the thermal noise (of +3/-3 standard deviations) as 1 uVpp does it mean that out of every thousand samples, 3 will have noise more than ±1 uV at any sample rate? 1000 sps will lead to 3 samples having more than ±1uV noise in a second, 2000 sps will lead to 6 samples having more than ±1uV noise in a second, and so on.
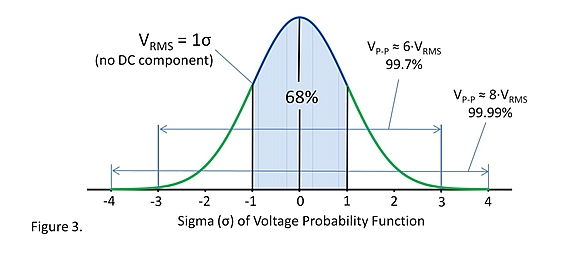
- Your interpretation is correct. When a datasheet specifies “peak-to-peak” noise within ±3 standard deviations, they are specifying the 99.7 percentile peaks.
- I’ve put “peak-to-peak” in quotes, because peak-to-peak of a Gaussian white noise is ±∞ from the purely mathematical point of view.
RMS is a better specification for Gaussian white noise than peak-to-peak. RMS has a mathematical property that it’s equal to standard divination when the signal has zero mean (no DC component). If a datasheet specifies RMS, then it implies ±1 standard deviations, and it doesn’t need to specify the number of standard deviations.- RMS may be easier to measure with a digital oscilloscope than catching thousands of peaks.
- 
- > If a data sheet gives the thermal noise (of +3/-3 standard deviations) as 1 uVpp does it mean that out of every thousand samples, 3 will have noise more than ±1 uV at any sample rate? 1000 sps will lead to 3 samples having more than ±1uV noise in a second, 2000 sps will lead to 6 samples having more than ±1uV noise in a second, and so on.
- Your interpretation is correct. When a datasheet specifies “peak-to-peak” noise within ±3 standard deviations, they are specifying the 99.7 percentile peaks.
- I’ve put “peak-to-peak” in quotes, because peak-to-peak of a Gaussian white noise is ±∞ from the purely mathematical point of view.
- RMS is a better specification for Gaussian white noise than peak-to-peak. RMS has a mathematical property that it’s equal to standard deviation when the signal has zero mean (no DC component). If a datasheet specifies RMS, then it implies ±1 standard deviations, and it doesn’t need to specify the number of standard deviations.
- RMS may be easier to measure with a digital oscilloscope than catching thousands of peaks.
- 
#1: Initial revision
> If a data sheet gives the thermal noise (of +3/-3 standard deviations) as 1 uVpp does it mean that out of every thousand samples, 3 will have noise more than ±1 uV at any sample rate? 1000 sps will lead to 3 samples having more than ±1uV noise in a second, 2000 sps will lead to 6 samples having more than ±1uV noise in a second, and so on. Your interpretation is correct. When a datasheet specifies “peak-to-peak” noise within ±3 standard deviations, they are specifying the 99.7 percentile peaks. I’ve put “peak-to-peak” in quotes, because peak-to-peak of a Gaussian white noise is ±∞ from the purely mathematical point of view. RMS is a better specification for Gaussian white noise than peak-to-peak. RMS has a mathematical property that it’s equal to standard divination when the signal has zero mean (no DC component). If a datasheet specifies RMS, then it implies ±1 standard deviations, and it doesn’t need to specify the number of standard deviations. RMS may be easier to measure with a digital oscilloscope than catching thousands of peaks. 


