Post History
#20: Post edited
by
 Lorenzo Donati
·
2023-08-10T13:58:42Z (almost 2 years ago)
Lorenzo Donati
·
2023-08-10T13:58:42Z (almost 2 years ago)
Retagged.
#19: Post edited
by
 Circuit fantasist
·
2022-10-23T12:24:22Z (over 2 years ago)
Circuit fantasist
·
2022-10-23T12:24:22Z (over 2 years ago)
Minor edit
- Need to visualize voltage distribution
- --------------------------------------
- Once visualized the [voltages of the internal circuit points](https://electrical.codidact.com/posts/284860), we can go even further and "enter" inside resistors to visualize the voltages along the resistive film. This will allow us to see some interesting points (for example, virtual ground), the operation of well-known electrical devices (potentiometer, resistive summer) and electronic circuits (inverting, non-inverting, differential and instrumentation amplifiers).
- First ideas
- -----------
- This idea came to me in the early 90's. Then, for the purposes of intuitive understanding, I began representing local voltages inside resistors by a set of vertical segments whose length (height) was proportional to the local voltage magnitude (I named it _voltage diagram_). This notion of voltage came from a [hydraulic analogy](https://en.wikibooks.org/wiki/Circuit_Idea/Walking_along_the_Resistive_Film#Hydraulic_analogy:_Pressure_diagram) (a garden hose with evenly drilled holes) which I had seen in an old Electrical Engineering textbook. See, for example, an yellowed sheet of paper from my archive where, in 1990, I drew the voltage diagram of a resistor voltage summer:
- 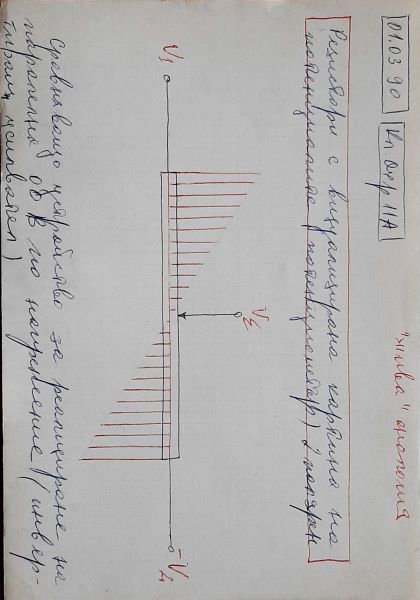
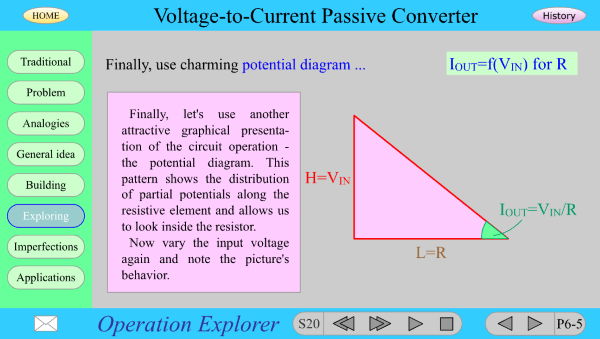
- It is more convenient to display only the shell of the diagram. Thus a triangle is obtained in which the vertical leg is the voltage V, the horizontal leg is the resistance R, and the angle between the hypotenuse and the horizontal leg represents the current I (another geometric representation of Ohm's law, see the Flash picture below).
- I developed [various kinds of voltage diagrams](https://photos.app.goo.gl/aeQJAx4sqDEYDdtN8). I colored them in red (an association with pressure) to easily distinguish them from circuit diagrams drawn in black.
- Sophisticated voltage diagrams
- ------------------------------
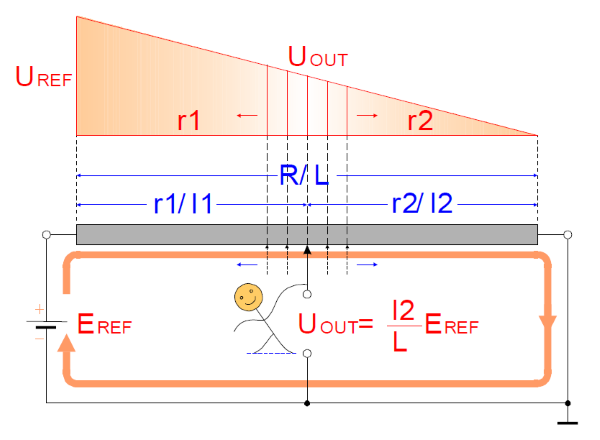
- Later, I drew more sophisticated voltage pictures by means of Corel Draw. See, for example, the circuit of a _voltage divider_ with constant input voltage VREF (applied from the left)...
- 
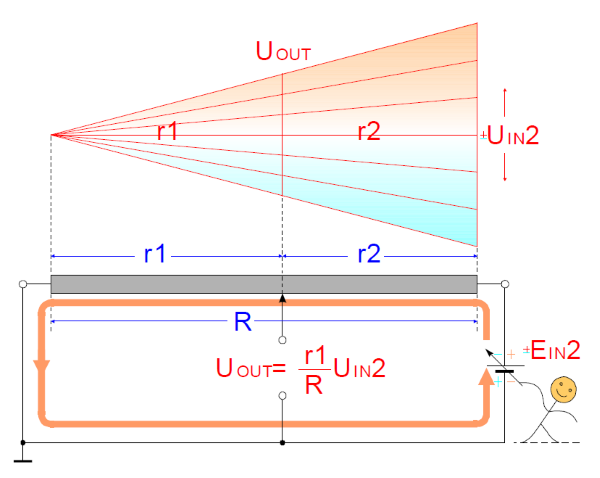
- ... and of a voltage divider with varying (from the right) input voltage Vin2 (I made them in the late 90's):
- 
- "Live" voltage diagrams
- -----------------------
- In 2000, I made [Flash animated circuit tutorials](https://www.circuit-fantasia.com/collections/circuit-collection/circuits/old-circuits/v-to-i-old.html) with "live"voltage diagrams that were changing proportionally to the voltage magnitude (you need [Ruffle Flash emulator](https://www.blogger.com/blog/post/edit/6662876180507761501/8403863750906537047#) to see this movie because Adobe Flash player is no longer supported).
- 
- "Really live" voltage diagrams
- ----------------------------
- But then I had the desire to make "really live" voltage diagrams that use actually measured voltages at several base points in the circuit. For this purpose, I used MICROLAB data acquisition system (see the [Wikibooks story about Ohm's experiment](https://en.wikibooks.org/wiki/Circuit_Idea/Walking_along_the_Resistive_Film#How_to_visualize_the_voltage_diagram_on_the_screen) and the detailed 5 min [movie](https://photos.app.goo.gl/TDUKTRKeNPoc4mMC7)):
- 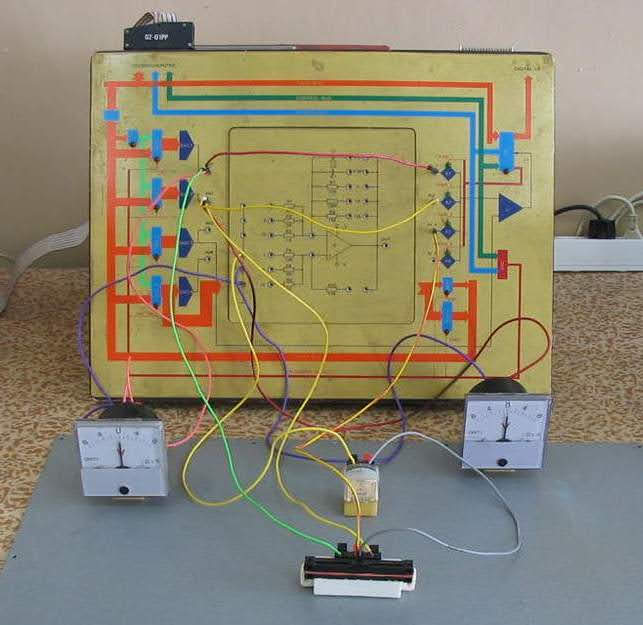
- In this attractive experiment, a linear potentiometer was supplied by two DACs and the voltages of its three terminals (E1 of the left end, E2 of the right end and E3 of the wiper) were measured by three ADC inputs. The other points of the voltage diagram were calculated. Also, conventional voltmeters were connected:
- 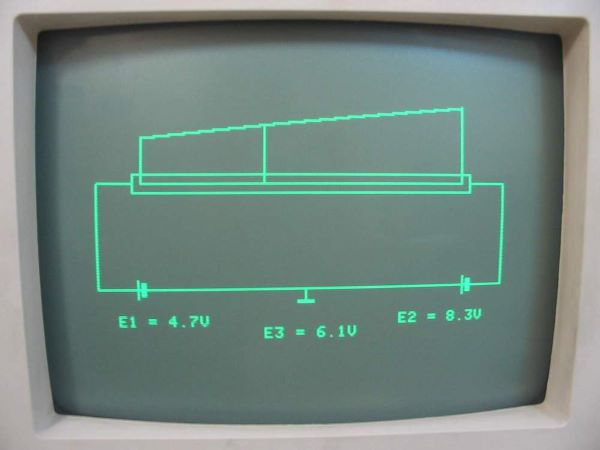
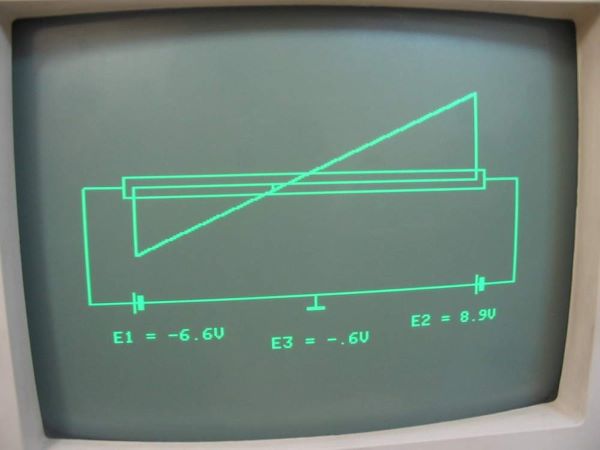
- When E1 and E2 had opposite polarities, the famous _virtual ground_ appeared:
- 
- The content is more important than form
- ---------------------------------------
- But, as in the case of [current loops](https://electrical.codidact.com/posts/284816) and [voltage bars](https://electrical.codidact.com/posts/284860), I finally came to the conclusion that content was more important than form... and I began to draw circuit diagrams with superimposed voltage pictures by hand. For example, in the [Wikibooks story about Ohm's experiment](https://en.wikibooks.org/wiki/Circuit_Idea/Walking_along_the_Resistive_Film), I have drawn the voltage diagrams by color fiber pens on a white sheet of paper. Here is an example of a _voltage divider_ with constant input voltage V...
- 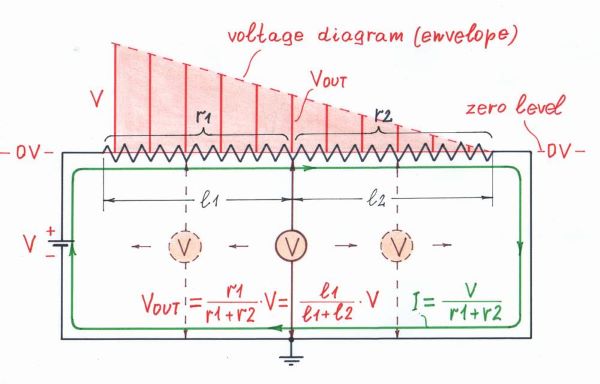
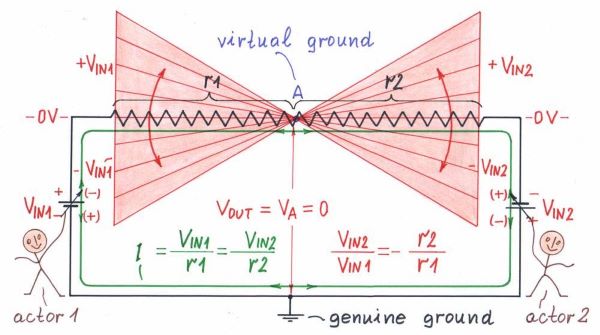
- ... and of a _resistor summer_ with oppositely varying input voltages Vin1 and Vin2 (an illustration of an op-amp voltage inverter):
- 
- Voltage diagrams vs voltage bars
- --------------------------------
- What do voltage diagrams actually represent compared with voltage bars? The voltage diagram is a further development of the voltage bar representation. Voltage bars are a one-dimensional way of representing voltages while the voltage diagram is a two-dimensional way. The voltage diagram is a set of voltage bars.
- The voltage diagram is based on a linearly distributed resistance along the length of the resistor. In most cases this representation is artificial, because ordinary resistors in electronic circuits are discrete; but it allows to illustrate the circuit operation with voltage diagram. In many cases, quantitative parameters (transfer ratios, etc.) can be directly seen.
- Voltage diagrams vs oscillograms
- --------------------------------
- What is the difference between a voltage diagram and voltage oscillogram at a given point in the diagram? The difference is significant, they have nothing in common. The voltage diagram shows voltage distribution along a resistance film, ie what local voltages inside a resistor are. The resistor is considered not as a "point" (without dimensions) but as a "line" (at each point of this line, in a certain step, a section perpendicular to the line is drawn, with a height proportional to the voltage at this point).
- An oscillogram is a set of points that represent voltages (by a vertical displacement) at successive points in time through. So, the particular segments of a voltage diagram represent the voltages at particular points of the resistive layer at the same time while the oscillogram shows the voltages at one point but at different points in time.
- Helping the online learning
- ---------------------------
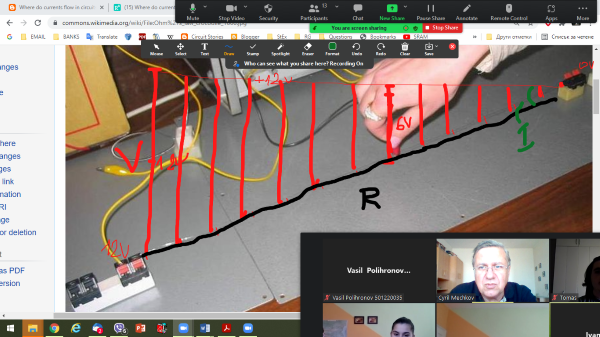
- As I have said in the stories about [current loops](https://electrical.codidact.com/posts/284816) and [voltage bars](https://electrical.codidact.com/posts/284860), a year ago, when we switched to online learning, I started using the ZOOM pen to draw on existing web circuit diagrams. This turned out to be a very powerful didactic technique that I managed to improve even more on the last exercise. I will show you how this happened at the final part of the last exercise (11.11.21) on Semiconductor Devices with group 49a, ITI, FCST of Technical University of Sofia. I make full video recordings of ZOOM meetings with my students and, with their permission, I will use a link to the [latest record](https://photos.app.goo.gl/bGLcshsiVdYn4WhS6) (in Bulgarian). Here is also a snapshot of ZOOM whiteboard (really, the picture is not so beautiful... but attractive:-)
- 
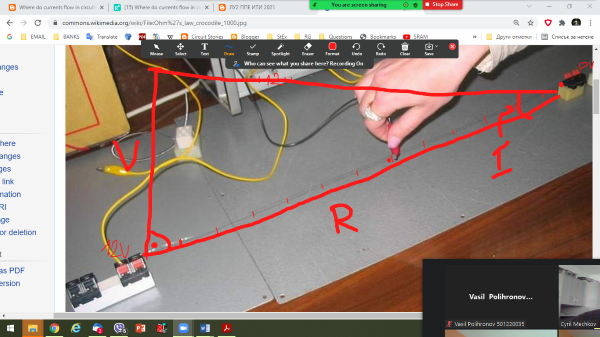
- In another snapshot, I have drawn the Ohm's triangle on the resistive wire (the vertical leg is the voltage V, the horizontal leg is the resistance R, and the angle between the hypotenuse and the horizontal leg represents the current I):
- 
- It will be interesting for me to know your opinion about this didactic technique.
- See also
- --------
[What are voltages in circuits?](https://electrical.codidact.com/posts/284860) (voltage diagram)- [Where do currents flow in circuits?](https://electrical.codidact.com/posts/284816) (current loops with proportional thickness)
- Web Resources
- -------------
- [How to Visualize Voltages inside Resistors](https://en.wikibooks.org/wiki/Circuit_Idea/How_to_Visualize_Voltages_inside_Resistors) (Circuit Idea wikibook)
- Need to visualize voltage distribution
- --------------------------------------
- Once visualized the [voltages of the internal circuit points](https://electrical.codidact.com/posts/284860), we can go even further and "enter" inside resistors to visualize the voltages along the resistive film. This will allow us to see some interesting points (for example, virtual ground), the operation of well-known electrical devices (potentiometer, resistive summer) and electronic circuits (inverting, non-inverting, differential and instrumentation amplifiers).
- First ideas
- -----------
- This idea came to me in the early 90's. Then, for the purposes of intuitive understanding, I began representing local voltages inside resistors by a set of vertical segments whose length (height) was proportional to the local voltage magnitude (I named it _voltage diagram_). This notion of voltage came from a [hydraulic analogy](https://en.wikibooks.org/wiki/Circuit_Idea/Walking_along_the_Resistive_Film#Hydraulic_analogy:_Pressure_diagram) (a garden hose with evenly drilled holes) which I had seen in an old Electrical Engineering textbook. See, for example, an yellowed sheet of paper from my archive where, in 1990, I drew the voltage diagram of a resistor voltage summer:
- 
- It is more convenient to display only the shell of the diagram. Thus a triangle is obtained in which the vertical leg is the voltage V, the horizontal leg is the resistance R, and the angle between the hypotenuse and the horizontal leg represents the current I (another geometric representation of Ohm's law, see the Flash picture below).
- I developed [various kinds of voltage diagrams](https://photos.app.goo.gl/aeQJAx4sqDEYDdtN8). I colored them in red (an association with pressure) to easily distinguish them from circuit diagrams drawn in black.
- Sophisticated voltage diagrams
- ------------------------------
- Later, I drew more sophisticated voltage pictures by means of Corel Draw. See, for example, the circuit of a _voltage divider_ with constant input voltage VREF (applied from the left)...
- 
- ... and of a voltage divider with varying (from the right) input voltage Vin2 (I made them in the late 90's):
- 
- "Live" voltage diagrams
- -----------------------
- In 2000, I made [Flash animated circuit tutorials](https://www.circuit-fantasia.com/collections/circuit-collection/circuits/old-circuits/v-to-i-old.html) with "live"voltage diagrams that were changing proportionally to the voltage magnitude (you need [Ruffle Flash emulator](https://www.blogger.com/blog/post/edit/6662876180507761501/8403863750906537047#) to see this movie because Adobe Flash player is no longer supported).
- 
- "Really live" voltage diagrams
- ----------------------------
- But then I had the desire to make "really live" voltage diagrams that use actually measured voltages at several base points in the circuit. For this purpose, I used MICROLAB data acquisition system (see the [Wikibooks story about Ohm's experiment](https://en.wikibooks.org/wiki/Circuit_Idea/Walking_along_the_Resistive_Film#How_to_visualize_the_voltage_diagram_on_the_screen) and the detailed 5 min [movie](https://photos.app.goo.gl/TDUKTRKeNPoc4mMC7)):
- 
- In this attractive experiment, a linear potentiometer was supplied by two DACs and the voltages of its three terminals (E1 of the left end, E2 of the right end and E3 of the wiper) were measured by three ADC inputs. The other points of the voltage diagram were calculated. Also, conventional voltmeters were connected:
- 
- When E1 and E2 had opposite polarities, the famous _virtual ground_ appeared:
- 
- The content is more important than form
- ---------------------------------------
- But, as in the case of [current loops](https://electrical.codidact.com/posts/284816) and [voltage bars](https://electrical.codidact.com/posts/284860), I finally came to the conclusion that content was more important than form... and I began to draw circuit diagrams with superimposed voltage pictures by hand. For example, in the [Wikibooks story about Ohm's experiment](https://en.wikibooks.org/wiki/Circuit_Idea/Walking_along_the_Resistive_Film), I have drawn the voltage diagrams by color fiber pens on a white sheet of paper. Here is an example of a _voltage divider_ with constant input voltage V...
- 
- ... and of a _resistor summer_ with oppositely varying input voltages Vin1 and Vin2 (an illustration of an op-amp voltage inverter):
- 
- Voltage diagrams vs voltage bars
- --------------------------------
- What do voltage diagrams actually represent compared with voltage bars? The voltage diagram is a further development of the voltage bar representation. Voltage bars are a one-dimensional way of representing voltages while the voltage diagram is a two-dimensional way. The voltage diagram is a set of voltage bars.
- The voltage diagram is based on a linearly distributed resistance along the length of the resistor. In most cases this representation is artificial, because ordinary resistors in electronic circuits are discrete; but it allows to illustrate the circuit operation with voltage diagram. In many cases, quantitative parameters (transfer ratios, etc.) can be directly seen.
- Voltage diagrams vs oscillograms
- --------------------------------
- What is the difference between a voltage diagram and voltage oscillogram at a given point in the diagram? The difference is significant, they have nothing in common. The voltage diagram shows voltage distribution along a resistance film, ie what local voltages inside a resistor are. The resistor is considered not as a "point" (without dimensions) but as a "line" (at each point of this line, in a certain step, a section perpendicular to the line is drawn, with a height proportional to the voltage at this point).
- An oscillogram is a set of points that represent voltages (by a vertical displacement) at successive points in time through. So, the particular segments of a voltage diagram represent the voltages at particular points of the resistive layer at the same time while the oscillogram shows the voltages at one point but at different points in time.
- Helping the online learning
- ---------------------------
- As I have said in the stories about [current loops](https://electrical.codidact.com/posts/284816) and [voltage bars](https://electrical.codidact.com/posts/284860), a year ago, when we switched to online learning, I started using the ZOOM pen to draw on existing web circuit diagrams. This turned out to be a very powerful didactic technique that I managed to improve even more on the last exercise. I will show you how this happened at the final part of the last exercise (11.11.21) on Semiconductor Devices with group 49a, ITI, FCST of Technical University of Sofia. I make full video recordings of ZOOM meetings with my students and, with their permission, I will use a link to the [latest record](https://photos.app.goo.gl/bGLcshsiVdYn4WhS6) (in Bulgarian). Here is also a snapshot of ZOOM whiteboard (really, the picture is not so beautiful... but attractive:-)
- 
- In another snapshot, I have drawn the Ohm's triangle on the resistive wire (the vertical leg is the voltage V, the horizontal leg is the resistance R, and the angle between the hypotenuse and the horizontal leg represents the current I):
- 
- It will be interesting for me to know your opinion about this didactic technique.
- See also
- --------
- [What are voltages in circuits?](https://electrical.codidact.com/posts/284860) (voltage bars with proportional height)
- [Where do currents flow in circuits?](https://electrical.codidact.com/posts/284816) (current loops with proportional thickness)
- Web Resources
- -------------
- [How to Visualize Voltages inside Resistors](https://en.wikibooks.org/wiki/Circuit_Idea/How_to_Visualize_Voltages_inside_Resistors) (Circuit Idea wikibook)
#18: Post edited
by
Circuit fantasist
·
2022-10-21T18:19:51Z (over 2 years ago)
Added links
- Need to visualize voltage distribution
- --------------------------------------
- Once visualized the [voltages of the internal circuit points](https://electrical.codidact.com/posts/284860), we can go even further and "enter" inside resistors to visualize the voltages along the resistive film. This will allow us to see some interesting points (for example, virtual ground), the operation of well-known electrical devices (potentiometer, resistive summer) and electronic circuits (inverting, non-inverting, differential and instrumentation amplifiers).
- First ideas
- -----------
- This idea came to me in the early 90's. Then, for the purposes of intuitive understanding, I began representing local voltages inside resistors by a set of vertical segments whose length (height) was proportional to the local voltage magnitude (I named it _voltage diagram_). This notion of voltage came from a [hydraulic analogy](https://en.wikibooks.org/wiki/Circuit_Idea/Walking_along_the_Resistive_Film#Hydraulic_analogy:_Pressure_diagram) (a garden hose with evenly drilled holes) which I had seen in an old Electrical Engineering textbook. See, for example, an yellowed sheet of paper from my archive where, in 1990, I drew the voltage diagram of a resistor voltage summer:
- 
- It is more convenient to display only the shell of the diagram. Thus a triangle is obtained in which the vertical leg is the voltage V, the horizontal leg is the resistance R, and the angle between the hypotenuse and the horizontal leg represents the current I (another geometric representation of Ohm's law, see the Flash picture below).
- I developed [various kinds of voltage diagrams](https://photos.app.goo.gl/aeQJAx4sqDEYDdtN8). I colored them in red (an association with pressure) to easily distinguish them from circuit diagrams drawn in black.
- Sophisticated voltage diagrams
- ------------------------------
- Later, I drew more sophisticated voltage pictures by means of Corel Draw. See, for example, the circuit of a _voltage divider_ with constant input voltage VREF (applied from the left)...
- 
- ... and of a voltage divider with varying (from the right) input voltage Vin2 (I made them in the late 90's):
- 
- "Live" voltage diagrams
- -----------------------
- In 2000, I made [Flash animated circuit tutorials](https://www.circuit-fantasia.com/collections/circuit-collection/circuits/old-circuits/v-to-i-old.html) with "live"voltage diagrams that were changing proportionally to the voltage magnitude (you need [Ruffle Flash emulator](https://www.blogger.com/blog/post/edit/6662876180507761501/8403863750906537047#) to see this movie because Adobe Flash player is no longer supported).
- 
- "Really live" voltage diagrams
- ----------------------------
- But then I had the desire to make "really live" voltage diagrams that use actually measured voltages at several base points in the circuit. For this purpose, I used MICROLAB data acquisition system (see the [Wikibooks story about Ohm's experiment](https://en.wikibooks.org/wiki/Circuit_Idea/Walking_along_the_Resistive_Film#How_to_visualize_the_voltage_diagram_on_the_screen) and the detailed 5 min [movie](https://photos.app.goo.gl/TDUKTRKeNPoc4mMC7)):
- 
- In this attractive experiment, a linear potentiometer was supplied by two DACs and the voltages of its three terminals (E1 of the left end, E2 of the right end and E3 of the wiper) were measured by three ADC inputs. The other points of the voltage diagram were calculated. Also, conventional voltmeters were connected:
- 
- When E1 and E2 had opposite polarities, the famous _virtual ground_ appeared:
- 
- The content is more important than form
- ---------------------------------------
- But, as in the case of [current loops](https://electrical.codidact.com/posts/284816) and [voltage bars](https://electrical.codidact.com/posts/284860), I finally came to the conclusion that content was more important than form... and I began to draw circuit diagrams with superimposed voltage pictures by hand. For example, in the [Wikibooks story about Ohm's experiment](https://en.wikibooks.org/wiki/Circuit_Idea/Walking_along_the_Resistive_Film), I have drawn the voltage diagrams by color fiber pens on a white sheet of paper. Here is an example of a _voltage divider_ with constant input voltage V...
- 
- ... and of a _resistor summer_ with oppositely varying input voltages Vin1 and Vin2 (an illustration of an op-amp voltage inverter):
- 
- Voltage diagrams vs voltage bars
- --------------------------------
- What do voltage diagrams actually represent compared with voltage bars? The voltage diagram is a further development of the voltage bar representation. Voltage bars are a one-dimensional way of representing voltages while the voltage diagram is a two-dimensional way. The voltage diagram is a set of voltage bars.
- The voltage diagram is based on a linearly distributed resistance along the length of the resistor. In most cases this representation is artificial, because ordinary resistors in electronic circuits are discrete; but it allows to illustrate the circuit operation with voltage diagram. In many cases, quantitative parameters (transfer ratios, etc.) can be directly seen.
- Voltage diagrams vs oscillograms
- --------------------------------
- What is the difference between a voltage diagram and voltage oscillogram at a given point in the diagram? The difference is significant, they have nothing in common. The voltage diagram shows voltage distribution along a resistance film, ie what local voltages inside a resistor are. The resistor is considered not as a "point" (without dimensions) but as a "line" (at each point of this line, in a certain step, a section perpendicular to the line is drawn, with a height proportional to the voltage at this point).
- An oscillogram is a set of points that represent voltages (by a vertical displacement) at successive points in time through. So, the particular segments of a voltage diagram represent the voltages at particular points of the resistive layer at the same time while the oscillogram shows the voltages at one point but at different points in time.
- Helping the online learning
- ---------------------------
- As I have said in the stories about [current loops](https://electrical.codidact.com/posts/284816) and [voltage bars](https://electrical.codidact.com/posts/284860), a year ago, when we switched to online learning, I started using the ZOOM pen to draw on existing web circuit diagrams. This turned out to be a very powerful didactic technique that I managed to improve even more on the last exercise. I will show you how this happened at the final part of the last exercise (11.11.21) on Semiconductor Devices with group 49a, ITI, FCST of Technical University of Sofia. I make full video recordings of ZOOM meetings with my students and, with their permission, I will use a link to the [latest record](https://photos.app.goo.gl/bGLcshsiVdYn4WhS6) (in Bulgarian). Here is also a snapshot of ZOOM whiteboard (really, the picture is not so beautiful... but attractive:-)
- 
- In another snapshot, I have drawn the Ohm's triangle on the resistive wire (the vertical leg is the voltage V, the horizontal leg is the resistance R, and the angle between the hypotenuse and the horizontal leg represents the current I):
- 
It will be interesting for me to know your opinion about this didactic technique.
- Need to visualize voltage distribution
- --------------------------------------
- Once visualized the [voltages of the internal circuit points](https://electrical.codidact.com/posts/284860), we can go even further and "enter" inside resistors to visualize the voltages along the resistive film. This will allow us to see some interesting points (for example, virtual ground), the operation of well-known electrical devices (potentiometer, resistive summer) and electronic circuits (inverting, non-inverting, differential and instrumentation amplifiers).
- First ideas
- -----------
- This idea came to me in the early 90's. Then, for the purposes of intuitive understanding, I began representing local voltages inside resistors by a set of vertical segments whose length (height) was proportional to the local voltage magnitude (I named it _voltage diagram_). This notion of voltage came from a [hydraulic analogy](https://en.wikibooks.org/wiki/Circuit_Idea/Walking_along_the_Resistive_Film#Hydraulic_analogy:_Pressure_diagram) (a garden hose with evenly drilled holes) which I had seen in an old Electrical Engineering textbook. See, for example, an yellowed sheet of paper from my archive where, in 1990, I drew the voltage diagram of a resistor voltage summer:
- 
- It is more convenient to display only the shell of the diagram. Thus a triangle is obtained in which the vertical leg is the voltage V, the horizontal leg is the resistance R, and the angle between the hypotenuse and the horizontal leg represents the current I (another geometric representation of Ohm's law, see the Flash picture below).
- I developed [various kinds of voltage diagrams](https://photos.app.goo.gl/aeQJAx4sqDEYDdtN8). I colored them in red (an association with pressure) to easily distinguish them from circuit diagrams drawn in black.
- Sophisticated voltage diagrams
- ------------------------------
- Later, I drew more sophisticated voltage pictures by means of Corel Draw. See, for example, the circuit of a _voltage divider_ with constant input voltage VREF (applied from the left)...
- 
- ... and of a voltage divider with varying (from the right) input voltage Vin2 (I made them in the late 90's):
- 
- "Live" voltage diagrams
- -----------------------
- In 2000, I made [Flash animated circuit tutorials](https://www.circuit-fantasia.com/collections/circuit-collection/circuits/old-circuits/v-to-i-old.html) with "live"voltage diagrams that were changing proportionally to the voltage magnitude (you need [Ruffle Flash emulator](https://www.blogger.com/blog/post/edit/6662876180507761501/8403863750906537047#) to see this movie because Adobe Flash player is no longer supported).
- 
- "Really live" voltage diagrams
- ----------------------------
- But then I had the desire to make "really live" voltage diagrams that use actually measured voltages at several base points in the circuit. For this purpose, I used MICROLAB data acquisition system (see the [Wikibooks story about Ohm's experiment](https://en.wikibooks.org/wiki/Circuit_Idea/Walking_along_the_Resistive_Film#How_to_visualize_the_voltage_diagram_on_the_screen) and the detailed 5 min [movie](https://photos.app.goo.gl/TDUKTRKeNPoc4mMC7)):
- 
- In this attractive experiment, a linear potentiometer was supplied by two DACs and the voltages of its three terminals (E1 of the left end, E2 of the right end and E3 of the wiper) were measured by three ADC inputs. The other points of the voltage diagram were calculated. Also, conventional voltmeters were connected:
- 
- When E1 and E2 had opposite polarities, the famous _virtual ground_ appeared:
- 
- The content is more important than form
- ---------------------------------------
- But, as in the case of [current loops](https://electrical.codidact.com/posts/284816) and [voltage bars](https://electrical.codidact.com/posts/284860), I finally came to the conclusion that content was more important than form... and I began to draw circuit diagrams with superimposed voltage pictures by hand. For example, in the [Wikibooks story about Ohm's experiment](https://en.wikibooks.org/wiki/Circuit_Idea/Walking_along_the_Resistive_Film), I have drawn the voltage diagrams by color fiber pens on a white sheet of paper. Here is an example of a _voltage divider_ with constant input voltage V...
- 
- ... and of a _resistor summer_ with oppositely varying input voltages Vin1 and Vin2 (an illustration of an op-amp voltage inverter):
- 
- Voltage diagrams vs voltage bars
- --------------------------------
- What do voltage diagrams actually represent compared with voltage bars? The voltage diagram is a further development of the voltage bar representation. Voltage bars are a one-dimensional way of representing voltages while the voltage diagram is a two-dimensional way. The voltage diagram is a set of voltage bars.
- The voltage diagram is based on a linearly distributed resistance along the length of the resistor. In most cases this representation is artificial, because ordinary resistors in electronic circuits are discrete; but it allows to illustrate the circuit operation with voltage diagram. In many cases, quantitative parameters (transfer ratios, etc.) can be directly seen.
- Voltage diagrams vs oscillograms
- --------------------------------
- What is the difference between a voltage diagram and voltage oscillogram at a given point in the diagram? The difference is significant, they have nothing in common. The voltage diagram shows voltage distribution along a resistance film, ie what local voltages inside a resistor are. The resistor is considered not as a "point" (without dimensions) but as a "line" (at each point of this line, in a certain step, a section perpendicular to the line is drawn, with a height proportional to the voltage at this point).
- An oscillogram is a set of points that represent voltages (by a vertical displacement) at successive points in time through. So, the particular segments of a voltage diagram represent the voltages at particular points of the resistive layer at the same time while the oscillogram shows the voltages at one point but at different points in time.
- Helping the online learning
- ---------------------------
- As I have said in the stories about [current loops](https://electrical.codidact.com/posts/284816) and [voltage bars](https://electrical.codidact.com/posts/284860), a year ago, when we switched to online learning, I started using the ZOOM pen to draw on existing web circuit diagrams. This turned out to be a very powerful didactic technique that I managed to improve even more on the last exercise. I will show you how this happened at the final part of the last exercise (11.11.21) on Semiconductor Devices with group 49a, ITI, FCST of Technical University of Sofia. I make full video recordings of ZOOM meetings with my students and, with their permission, I will use a link to the [latest record](https://photos.app.goo.gl/bGLcshsiVdYn4WhS6) (in Bulgarian). Here is also a snapshot of ZOOM whiteboard (really, the picture is not so beautiful... but attractive:-)
- 
- In another snapshot, I have drawn the Ohm's triangle on the resistive wire (the vertical leg is the voltage V, the horizontal leg is the resistance R, and the angle between the hypotenuse and the horizontal leg represents the current I):
- 
- It will be interesting for me to know your opinion about this didactic technique.
- See also
- --------
- [What are voltages in circuits?](https://electrical.codidact.com/posts/284860) (voltage diagram)
- [Where do currents flow in circuits?](https://electrical.codidact.com/posts/284816) (current loops with proportional thickness)
- Web Resources
- -------------
- [How to Visualize Voltages inside Resistors](https://en.wikibooks.org/wiki/Circuit_Idea/How_to_Visualize_Voltages_inside_Resistors) (Circuit Idea wikibook)
#17: Post edited
by
Circuit fantasist
·
2022-04-16T20:37:46Z (about 3 years ago)
Inserted picture of MICROLAB periphery
- Need to visualize voltage distribution
- --------------------------------------
- Once visualized the [voltages of the internal circuit points](https://electrical.codidact.com/posts/284860), we can go even further and "enter" inside resistors to visualize the voltages along the resistive film. This will allow us to see some interesting points (for example, virtual ground), the operation of well-known electrical devices (potentiometer, resistive summer) and electronic circuits (inverting, non-inverting, differential and instrumentation amplifiers).
- First ideas
- -----------
- This idea came to me in the early 90's. Then, for the purposes of intuitive understanding, I began representing local voltages inside resistors by a set of vertical segments whose length (height) was proportional to the local voltage magnitude (I named it _voltage diagram_). This notion of voltage came from a [hydraulic analogy](https://en.wikibooks.org/wiki/Circuit_Idea/Walking_along_the_Resistive_Film#Hydraulic_analogy:_Pressure_diagram) (a garden hose with evenly drilled holes) which I had seen in an old Electrical Engineering textbook. See, for example, an yellowed sheet of paper from my archive where, in 1990, I drew the voltage diagram of a resistor voltage summer:
- 
- It is more convenient to display only the shell of the diagram. Thus a triangle is obtained in which the vertical leg is the voltage V, the horizontal leg is the resistance R, and the angle between the hypotenuse and the horizontal leg represents the current I (another geometric representation of Ohm's law, see the Flash picture below).
- I developed [various kinds of voltage diagrams](https://photos.app.goo.gl/aeQJAx4sqDEYDdtN8). I colored them in red (an association with pressure) to easily distinguish them from circuit diagrams drawn in black.
- Sophisticated voltage diagrams
- ------------------------------
- Later, I drew more sophisticated voltage pictures by means of Corel Draw. See, for example, the circuit of a _voltage divider_ with constant input voltage VREF (applied from the left)...
- 
- ... and of a voltage divider with varying (from the right) input voltage Vin2 (I made them in the late 90's):
- 
- "Live" voltage diagrams
- -----------------------
- In 2000, I made [Flash animated circuit tutorials](https://www.circuit-fantasia.com/collections/circuit-collection/circuits/old-circuits/v-to-i-old.html) with "live"voltage diagrams that were changing proportionally to the voltage magnitude (you need [Ruffle Flash emulator](https://www.blogger.com/blog/post/edit/6662876180507761501/8403863750906537047#) to see this movie because Adobe Flash player is no longer supported).
- 
- "Really live" voltage diagrams
- ----------------------------
But then I had the desire to make "really live" voltage diagrams that use actually measured voltages at several base points in the circuit. For this purpose, I used MICROLAB data acquisition system (see the [Wikibooks story about Ohm's experiment](https://en.wikibooks.org/wiki/Circuit_Idea/Walking_along_the_Resistive_Film#How_to_visualize_the_voltage_diagram_on_the_screen) and the detailed 5 min [movie](https://photos.app.goo.gl/TDUKTRKeNPoc4mMC7)). In this attractive experiment, a linear potentiometer was supplied by two DACs and the voltages of its three terminals (E1 of the left end, E2 of the right end and E3 of the wiper) were measured by three ADC inputs. The other points of the voltage diagram were calculated. Also, conventional voltmeters were connected:- 
- When E1 and E2 had opposite polarities, the famous _virtual ground_ appeared:
- 
- The content is more important than form
- ---------------------------------------
- But, as in the case of [current loops](https://electrical.codidact.com/posts/284816) and [voltage bars](https://electrical.codidact.com/posts/284860), I finally came to the conclusion that content was more important than form... and I began to draw circuit diagrams with superimposed voltage pictures by hand. For example, in the [Wikibooks story about Ohm's experiment](https://en.wikibooks.org/wiki/Circuit_Idea/Walking_along_the_Resistive_Film), I have drawn the voltage diagrams by color fiber pens on a white sheet of paper. Here is an example of a _voltage divider_ with constant input voltage V...
- 
- ... and of a _resistor summer_ with oppositely varying input voltages Vin1 and Vin2 (an illustration of an op-amp voltage inverter):
- 
- Voltage diagrams vs voltage bars
- --------------------------------
- What do voltage diagrams actually represent compared with voltage bars? The voltage diagram is a further development of the voltage bar representation. Voltage bars are a one-dimensional way of representing voltages while the voltage diagram is a two-dimensional way. The voltage diagram is a set of voltage bars.
- The voltage diagram is based on a linearly distributed resistance along the length of the resistor. In most cases this representation is artificial, because ordinary resistors in electronic circuits are discrete; but it allows to illustrate the circuit operation with voltage diagram. In many cases, quantitative parameters (transfer ratios, etc.) can be directly seen.
- Voltage diagrams vs oscillograms
- --------------------------------
- What is the difference between a voltage diagram and voltage oscillogram at a given point in the diagram? The difference is significant, they have nothing in common. The voltage diagram shows voltage distribution along a resistance film, ie what local voltages inside a resistor are. The resistor is considered not as a "point" (without dimensions) but as a "line" (at each point of this line, in a certain step, a section perpendicular to the line is drawn, with a height proportional to the voltage at this point).
- An oscillogram is a set of points that represent voltages (by a vertical displacement) at successive points in time through. So, the particular segments of a voltage diagram represent the voltages at particular points of the resistive layer at the same time while the oscillogram shows the voltages at one point but at different points in time.
- Helping the online learning
- ---------------------------
- As I have said in the stories about [current loops](https://electrical.codidact.com/posts/284816) and [voltage bars](https://electrical.codidact.com/posts/284860), a year ago, when we switched to online learning, I started using the ZOOM pen to draw on existing web circuit diagrams. This turned out to be a very powerful didactic technique that I managed to improve even more on the last exercise. I will show you how this happened at the final part of the last exercise (11.11.21) on Semiconductor Devices with group 49a, ITI, FCST of Technical University of Sofia. I make full video recordings of ZOOM meetings with my students and, with their permission, I will use a link to the [latest record](https://photos.app.goo.gl/bGLcshsiVdYn4WhS6) (in Bulgarian). Here is also a snapshot of ZOOM whiteboard (really, the picture is not so beautiful... but attractive:-)
- 
- In another snapshot, I have drawn the Ohm's triangle on the resistive wire (the vertical leg is the voltage V, the horizontal leg is the resistance R, and the angle between the hypotenuse and the horizontal leg represents the current I):
- 
- It will be interesting for me to know your opinion about this didactic technique.
- Need to visualize voltage distribution
- --------------------------------------
- Once visualized the [voltages of the internal circuit points](https://electrical.codidact.com/posts/284860), we can go even further and "enter" inside resistors to visualize the voltages along the resistive film. This will allow us to see some interesting points (for example, virtual ground), the operation of well-known electrical devices (potentiometer, resistive summer) and electronic circuits (inverting, non-inverting, differential and instrumentation amplifiers).
- First ideas
- -----------
- This idea came to me in the early 90's. Then, for the purposes of intuitive understanding, I began representing local voltages inside resistors by a set of vertical segments whose length (height) was proportional to the local voltage magnitude (I named it _voltage diagram_). This notion of voltage came from a [hydraulic analogy](https://en.wikibooks.org/wiki/Circuit_Idea/Walking_along_the_Resistive_Film#Hydraulic_analogy:_Pressure_diagram) (a garden hose with evenly drilled holes) which I had seen in an old Electrical Engineering textbook. See, for example, an yellowed sheet of paper from my archive where, in 1990, I drew the voltage diagram of a resistor voltage summer:
- 
- It is more convenient to display only the shell of the diagram. Thus a triangle is obtained in which the vertical leg is the voltage V, the horizontal leg is the resistance R, and the angle between the hypotenuse and the horizontal leg represents the current I (another geometric representation of Ohm's law, see the Flash picture below).
- I developed [various kinds of voltage diagrams](https://photos.app.goo.gl/aeQJAx4sqDEYDdtN8). I colored them in red (an association with pressure) to easily distinguish them from circuit diagrams drawn in black.
- Sophisticated voltage diagrams
- ------------------------------
- Later, I drew more sophisticated voltage pictures by means of Corel Draw. See, for example, the circuit of a _voltage divider_ with constant input voltage VREF (applied from the left)...
- 
- ... and of a voltage divider with varying (from the right) input voltage Vin2 (I made them in the late 90's):
- 
- "Live" voltage diagrams
- -----------------------
- In 2000, I made [Flash animated circuit tutorials](https://www.circuit-fantasia.com/collections/circuit-collection/circuits/old-circuits/v-to-i-old.html) with "live"voltage diagrams that were changing proportionally to the voltage magnitude (you need [Ruffle Flash emulator](https://www.blogger.com/blog/post/edit/6662876180507761501/8403863750906537047#) to see this movie because Adobe Flash player is no longer supported).
- 
- "Really live" voltage diagrams
- ----------------------------
- But then I had the desire to make "really live" voltage diagrams that use actually measured voltages at several base points in the circuit. For this purpose, I used MICROLAB data acquisition system (see the [Wikibooks story about Ohm's experiment](https://en.wikibooks.org/wiki/Circuit_Idea/Walking_along_the_Resistive_Film#How_to_visualize_the_voltage_diagram_on_the_screen) and the detailed 5 min [movie](https://photos.app.goo.gl/TDUKTRKeNPoc4mMC7)):
- 
- In this attractive experiment, a linear potentiometer was supplied by two DACs and the voltages of its three terminals (E1 of the left end, E2 of the right end and E3 of the wiper) were measured by three ADC inputs. The other points of the voltage diagram were calculated. Also, conventional voltmeters were connected:
- 
- When E1 and E2 had opposite polarities, the famous _virtual ground_ appeared:
- 
- The content is more important than form
- ---------------------------------------
- But, as in the case of [current loops](https://electrical.codidact.com/posts/284816) and [voltage bars](https://electrical.codidact.com/posts/284860), I finally came to the conclusion that content was more important than form... and I began to draw circuit diagrams with superimposed voltage pictures by hand. For example, in the [Wikibooks story about Ohm's experiment](https://en.wikibooks.org/wiki/Circuit_Idea/Walking_along_the_Resistive_Film), I have drawn the voltage diagrams by color fiber pens on a white sheet of paper. Here is an example of a _voltage divider_ with constant input voltage V...
- 
- ... and of a _resistor summer_ with oppositely varying input voltages Vin1 and Vin2 (an illustration of an op-amp voltage inverter):
- 
- Voltage diagrams vs voltage bars
- --------------------------------
- What do voltage diagrams actually represent compared with voltage bars? The voltage diagram is a further development of the voltage bar representation. Voltage bars are a one-dimensional way of representing voltages while the voltage diagram is a two-dimensional way. The voltage diagram is a set of voltage bars.
- The voltage diagram is based on a linearly distributed resistance along the length of the resistor. In most cases this representation is artificial, because ordinary resistors in electronic circuits are discrete; but it allows to illustrate the circuit operation with voltage diagram. In many cases, quantitative parameters (transfer ratios, etc.) can be directly seen.
- Voltage diagrams vs oscillograms
- --------------------------------
- What is the difference between a voltage diagram and voltage oscillogram at a given point in the diagram? The difference is significant, they have nothing in common. The voltage diagram shows voltage distribution along a resistance film, ie what local voltages inside a resistor are. The resistor is considered not as a "point" (without dimensions) but as a "line" (at each point of this line, in a certain step, a section perpendicular to the line is drawn, with a height proportional to the voltage at this point).
- An oscillogram is a set of points that represent voltages (by a vertical displacement) at successive points in time through. So, the particular segments of a voltage diagram represent the voltages at particular points of the resistive layer at the same time while the oscillogram shows the voltages at one point but at different points in time.
- Helping the online learning
- ---------------------------
- As I have said in the stories about [current loops](https://electrical.codidact.com/posts/284816) and [voltage bars](https://electrical.codidact.com/posts/284860), a year ago, when we switched to online learning, I started using the ZOOM pen to draw on existing web circuit diagrams. This turned out to be a very powerful didactic technique that I managed to improve even more on the last exercise. I will show you how this happened at the final part of the last exercise (11.11.21) on Semiconductor Devices with group 49a, ITI, FCST of Technical University of Sofia. I make full video recordings of ZOOM meetings with my students and, with their permission, I will use a link to the [latest record](https://photos.app.goo.gl/bGLcshsiVdYn4WhS6) (in Bulgarian). Here is also a snapshot of ZOOM whiteboard (really, the picture is not so beautiful... but attractive:-)
- 
- In another snapshot, I have drawn the Ohm's triangle on the resistive wire (the vertical leg is the voltage V, the horizontal leg is the resistance R, and the angle between the hypotenuse and the horizontal leg represents the current I):
- 
- It will be interesting for me to know your opinion about this didactic technique.
#16: Post edited
by
Circuit fantasist
·
2022-04-16T17:18:16Z (about 3 years ago)
Minor edit
- Need to visualize voltage distribution
- --------------------------------------
Once visualized the [voltages at the internal circuit points](https://electrical.codidact.com/posts/284860), we can go even further and "enter" inside resistors to visualize the voltages along the resistive film. This will allow us to see some interesting points (for example, virtual ground), the operation of well-known electrical devices (potentiometer, resistive summer) and electronic circuits (inverting, non-inverting, differential and instrumentation amplifiers).- First ideas
- -----------
- This idea came to me in the early 90's. Then, for the purposes of intuitive understanding, I began representing local voltages inside resistors by a set of vertical segments whose length (height) was proportional to the local voltage magnitude (I named it _voltage diagram_). This notion of voltage came from a [hydraulic analogy](https://en.wikibooks.org/wiki/Circuit_Idea/Walking_along_the_Resistive_Film#Hydraulic_analogy:_Pressure_diagram) (a garden hose with evenly drilled holes) which I had seen in an old Electrical Engineering textbook. See, for example, an yellowed sheet of paper from my archive where, in 1990, I drew the voltage diagram of a resistor voltage summer:
- 
- It is more convenient to display only the shell of the diagram. Thus a triangle is obtained in which the vertical leg is the voltage V, the horizontal leg is the resistance R, and the angle between the hypotenuse and the horizontal leg represents the current I (another geometric representation of Ohm's law, see the Flash picture below).
- I developed [various kinds of voltage diagrams](https://photos.app.goo.gl/aeQJAx4sqDEYDdtN8). I colored them in red (an association with pressure) to easily distinguish them from circuit diagrams drawn in black.
- Sophisticated voltage diagrams
- ------------------------------
- Later, I drew more sophisticated voltage pictures by means of Corel Draw. See, for example, the circuit of a _voltage divider_ with constant input voltage VREF (applied from the left)...
- 
- ... and of a voltage divider with varying (from the right) input voltage Vin2 (I made them in the late 90's):
- 
- "Live" voltage diagrams
- -----------------------
- In 2000, I made [Flash animated circuit tutorials](https://www.circuit-fantasia.com/collections/circuit-collection/circuits/old-circuits/v-to-i-old.html) with "live"voltage diagrams that were changing proportionally to the voltage magnitude (you need [Ruffle Flash emulator](https://www.blogger.com/blog/post/edit/6662876180507761501/8403863750906537047#) to see this movie because Adobe Flash player is no longer supported).
- 
- "Really live" voltage diagrams
- ----------------------------
- But then I had the desire to make "really live" voltage diagrams that use actually measured voltages at several base points in the circuit. For this purpose, I used MICROLAB data acquisition system (see the [Wikibooks story about Ohm's experiment](https://en.wikibooks.org/wiki/Circuit_Idea/Walking_along_the_Resistive_Film#How_to_visualize_the_voltage_diagram_on_the_screen) and the detailed 5 min [movie](https://photos.app.goo.gl/TDUKTRKeNPoc4mMC7)). In this attractive experiment, a linear potentiometer was supplied by two DACs and the voltages of its three terminals (E1 of the left end, E2 of the right end and E3 of the wiper) were measured by three ADC inputs. The other points of the voltage diagram were calculated. Also, conventional voltmeters were connected:
- 
- When E1 and E2 had opposite polarities, the famous _virtual ground_ appeared:
- 
- The content is more important than form
- ---------------------------------------
- But, as in the case of [current loops](https://electrical.codidact.com/posts/284816) and [voltage bars](https://electrical.codidact.com/posts/284860), I finally came to the conclusion that content was more important than form... and I began to draw circuit diagrams with superimposed voltage pictures by hand. For example, in the [Wikibooks story about Ohm's experiment](https://en.wikibooks.org/wiki/Circuit_Idea/Walking_along_the_Resistive_Film), I have drawn the voltage diagrams by color fiber pens on a white sheet of paper. Here is an example of a _voltage divider_ with constant input voltage V...
- 
- ... and of a _resistor summer_ with oppositely varying input voltages Vin1 and Vin2 (an illustration of an op-amp voltage inverter):
- 
- Voltage diagrams vs voltage bars
- --------------------------------
- What do voltage diagrams actually represent compared with voltage bars? The voltage diagram is a further development of the voltage bar representation. Voltage bars are a one-dimensional way of representing voltages while the voltage diagram is a two-dimensional way. The voltage diagram is a set of voltage bars.
- The voltage diagram is based on a linearly distributed resistance along the length of the resistor. In most cases this representation is artificial, because ordinary resistors in electronic circuits are discrete; but it allows to illustrate the circuit operation with voltage diagram. In many cases, quantitative parameters (transfer ratios, etc.) can be directly seen.
- Voltage diagrams vs oscillograms
- --------------------------------
- What is the difference between a voltage diagram and voltage oscillogram at a given point in the diagram? The difference is significant, they have nothing in common. The voltage diagram shows voltage distribution along a resistance film, ie what local voltages inside a resistor are. The resistor is considered not as a "point" (without dimensions) but as a "line" (at each point of this line, in a certain step, a section perpendicular to the line is drawn, with a height proportional to the voltage at this point).
- An oscillogram is a set of points that represent voltages (by a vertical displacement) at successive points in time through. So, the particular segments of a voltage diagram represent the voltages at particular points of the resistive layer at the same time while the oscillogram shows the voltages at one point but at different points in time.
- Helping the online learning
- ---------------------------
As I have said in the stories about [current loops](https://electrical.codidact.com/posts/284816) and [voltage bars](https://electrical.codidact.com/posts/284860), a year ago, when we switched to online learning, I started using the ZOOM pen to draw on existing web circuit diagrams. This turned out to be a very powerful didactic technique that I managed to improve even more on the last exercise. I will show you how this happened at the final part of the last exercise (11.11.21) on Semiconductor Devices with group 49a, ITI, FCST of Technical University of Sofia. I make full video recordings of ZOOM meetings with my students and, with their permission, I will use a link to the [latest record](https://photos.app.goo.gl/bGLcshsiVdYn4WhS6) (in Bulgarian). Here is also a snapshot of ZOOM whiteborad (really, the picture is not so beautiful... but attractive:-)- 
- In another snapshot, I have drawn the Ohm's triangle on the resistive wire (the vertical leg is the voltage V, the horizontal leg is the resistance R, and the angle between the hypotenuse and the horizontal leg represents the current I):
- 
- It will be interesting for me to know your opinion about this didactic technique.
- Need to visualize voltage distribution
- --------------------------------------
- Once visualized the [voltages of the internal circuit points](https://electrical.codidact.com/posts/284860), we can go even further and "enter" inside resistors to visualize the voltages along the resistive film. This will allow us to see some interesting points (for example, virtual ground), the operation of well-known electrical devices (potentiometer, resistive summer) and electronic circuits (inverting, non-inverting, differential and instrumentation amplifiers).
- First ideas
- -----------
- This idea came to me in the early 90's. Then, for the purposes of intuitive understanding, I began representing local voltages inside resistors by a set of vertical segments whose length (height) was proportional to the local voltage magnitude (I named it _voltage diagram_). This notion of voltage came from a [hydraulic analogy](https://en.wikibooks.org/wiki/Circuit_Idea/Walking_along_the_Resistive_Film#Hydraulic_analogy:_Pressure_diagram) (a garden hose with evenly drilled holes) which I had seen in an old Electrical Engineering textbook. See, for example, an yellowed sheet of paper from my archive where, in 1990, I drew the voltage diagram of a resistor voltage summer:
- 
- It is more convenient to display only the shell of the diagram. Thus a triangle is obtained in which the vertical leg is the voltage V, the horizontal leg is the resistance R, and the angle between the hypotenuse and the horizontal leg represents the current I (another geometric representation of Ohm's law, see the Flash picture below).
- I developed [various kinds of voltage diagrams](https://photos.app.goo.gl/aeQJAx4sqDEYDdtN8). I colored them in red (an association with pressure) to easily distinguish them from circuit diagrams drawn in black.
- Sophisticated voltage diagrams
- ------------------------------
- Later, I drew more sophisticated voltage pictures by means of Corel Draw. See, for example, the circuit of a _voltage divider_ with constant input voltage VREF (applied from the left)...
- 
- ... and of a voltage divider with varying (from the right) input voltage Vin2 (I made them in the late 90's):
- 
- "Live" voltage diagrams
- -----------------------
- In 2000, I made [Flash animated circuit tutorials](https://www.circuit-fantasia.com/collections/circuit-collection/circuits/old-circuits/v-to-i-old.html) with "live"voltage diagrams that were changing proportionally to the voltage magnitude (you need [Ruffle Flash emulator](https://www.blogger.com/blog/post/edit/6662876180507761501/8403863750906537047#) to see this movie because Adobe Flash player is no longer supported).
- 
- "Really live" voltage diagrams
- ----------------------------
- But then I had the desire to make "really live" voltage diagrams that use actually measured voltages at several base points in the circuit. For this purpose, I used MICROLAB data acquisition system (see the [Wikibooks story about Ohm's experiment](https://en.wikibooks.org/wiki/Circuit_Idea/Walking_along_the_Resistive_Film#How_to_visualize_the_voltage_diagram_on_the_screen) and the detailed 5 min [movie](https://photos.app.goo.gl/TDUKTRKeNPoc4mMC7)). In this attractive experiment, a linear potentiometer was supplied by two DACs and the voltages of its three terminals (E1 of the left end, E2 of the right end and E3 of the wiper) were measured by three ADC inputs. The other points of the voltage diagram were calculated. Also, conventional voltmeters were connected:
- 
- When E1 and E2 had opposite polarities, the famous _virtual ground_ appeared:
- 
- The content is more important than form
- ---------------------------------------
- But, as in the case of [current loops](https://electrical.codidact.com/posts/284816) and [voltage bars](https://electrical.codidact.com/posts/284860), I finally came to the conclusion that content was more important than form... and I began to draw circuit diagrams with superimposed voltage pictures by hand. For example, in the [Wikibooks story about Ohm's experiment](https://en.wikibooks.org/wiki/Circuit_Idea/Walking_along_the_Resistive_Film), I have drawn the voltage diagrams by color fiber pens on a white sheet of paper. Here is an example of a _voltage divider_ with constant input voltage V...
- 
- ... and of a _resistor summer_ with oppositely varying input voltages Vin1 and Vin2 (an illustration of an op-amp voltage inverter):
- 
- Voltage diagrams vs voltage bars
- --------------------------------
- What do voltage diagrams actually represent compared with voltage bars? The voltage diagram is a further development of the voltage bar representation. Voltage bars are a one-dimensional way of representing voltages while the voltage diagram is a two-dimensional way. The voltage diagram is a set of voltage bars.
- The voltage diagram is based on a linearly distributed resistance along the length of the resistor. In most cases this representation is artificial, because ordinary resistors in electronic circuits are discrete; but it allows to illustrate the circuit operation with voltage diagram. In many cases, quantitative parameters (transfer ratios, etc.) can be directly seen.
- Voltage diagrams vs oscillograms
- --------------------------------
- What is the difference between a voltage diagram and voltage oscillogram at a given point in the diagram? The difference is significant, they have nothing in common. The voltage diagram shows voltage distribution along a resistance film, ie what local voltages inside a resistor are. The resistor is considered not as a "point" (without dimensions) but as a "line" (at each point of this line, in a certain step, a section perpendicular to the line is drawn, with a height proportional to the voltage at this point).
- An oscillogram is a set of points that represent voltages (by a vertical displacement) at successive points in time through. So, the particular segments of a voltage diagram represent the voltages at particular points of the resistive layer at the same time while the oscillogram shows the voltages at one point but at different points in time.
- Helping the online learning
- ---------------------------
- As I have said in the stories about [current loops](https://electrical.codidact.com/posts/284816) and [voltage bars](https://electrical.codidact.com/posts/284860), a year ago, when we switched to online learning, I started using the ZOOM pen to draw on existing web circuit diagrams. This turned out to be a very powerful didactic technique that I managed to improve even more on the last exercise. I will show you how this happened at the final part of the last exercise (11.11.21) on Semiconductor Devices with group 49a, ITI, FCST of Technical University of Sofia. I make full video recordings of ZOOM meetings with my students and, with their permission, I will use a link to the [latest record](https://photos.app.goo.gl/bGLcshsiVdYn4WhS6) (in Bulgarian). Here is also a snapshot of ZOOM whiteboard (really, the picture is not so beautiful... but attractive:-)
- 
- In another snapshot, I have drawn the Ohm's triangle on the resistive wire (the vertical leg is the voltage V, the horizontal leg is the resistance R, and the angle between the hypotenuse and the horizontal leg represents the current I):
- 
- It will be interesting for me to know your opinion about this didactic technique.
#15: Post edited
by
Circuit fantasist
·
2022-03-29T18:53:58Z (about 3 years ago)
Structuring (added another subtitle)
- Need to visualize voltage distribution
- --------------------------------------
- Once visualized the [voltages at the internal circuit points](https://electrical.codidact.com/posts/284860), we can go even further and "enter" inside resistors to visualize the voltages along the resistive film. This will allow us to see some interesting points (for example, virtual ground), the operation of well-known electrical devices (potentiometer, resistive summer) and electronic circuits (inverting, non-inverting, differential and instrumentation amplifiers).
- First ideas
- -----------
- This idea came to me in the early 90's. Then, for the purposes of intuitive understanding, I began representing local voltages inside resistors by a set of vertical segments whose length (height) was proportional to the local voltage magnitude (I named it _voltage diagram_). This notion of voltage came from a [hydraulic analogy](https://en.wikibooks.org/wiki/Circuit_Idea/Walking_along_the_Resistive_Film#Hydraulic_analogy:_Pressure_diagram) (a garden hose with evenly drilled holes) which I had seen in an old Electrical Engineering textbook. See, for example, an yellowed sheet of paper from my archive where, in 1990, I drew the voltage diagram of a resistor voltage summer:
- 
- It is more convenient to display only the shell of the diagram. Thus a triangle is obtained in which the vertical leg is the voltage V, the horizontal leg is the resistance R, and the angle between the hypotenuse and the horizontal leg represents the current I (another geometric representation of Ohm's law, see the Flash picture below).
- I developed [various kinds of voltage diagrams](https://photos.app.goo.gl/aeQJAx4sqDEYDdtN8). I colored them in red (an association with pressure) to easily distinguish them from circuit diagrams drawn in black.
- Sophisticated voltage diagrams
- ------------------------------
- Later, I drew more sophisticated voltage pictures by means of Corel Draw. See, for example, the circuit of a _voltage divider_ with constant input voltage VREF (applied from the left)...
- 
- ... and of a voltage divider with varying (from the right) input voltage Vin2 (I made them in the late 90's):
- 
- "Live" voltage diagrams
- -----------------------
- In 2000, I made [Flash animated circuit tutorials](https://www.circuit-fantasia.com/collections/circuit-collection/circuits/old-circuits/v-to-i-old.html) with "live"voltage diagrams that were changing proportionally to the voltage magnitude (you need [Ruffle Flash emulator](https://www.blogger.com/blog/post/edit/6662876180507761501/8403863750906537047#) to see this movie because Adobe Flash player is no longer supported).
- 
- "Really live" voltage diagrams
- ----------------------------
- But then I had the desire to make "really live" voltage diagrams that use actually measured voltages at several base points in the circuit. For this purpose, I used MICROLAB data acquisition system (see the [Wikibooks story about Ohm's experiment](https://en.wikibooks.org/wiki/Circuit_Idea/Walking_along_the_Resistive_Film#How_to_visualize_the_voltage_diagram_on_the_screen) and the detailed 5 min [movie](https://photos.app.goo.gl/TDUKTRKeNPoc4mMC7)). In this attractive experiment, a linear potentiometer was supplied by two DACs and the voltages of its three terminals (E1 of the left end, E2 of the right end and E3 of the wiper) were measured by three ADC inputs. The other points of the voltage diagram were calculated. Also, conventional voltmeters were connected:
- 
- When E1 and E2 had opposite polarities, the famous _virtual ground_ appeared:
- 
- The content is more important than form
- ---------------------------------------
- But, as in the case of [current loops](https://electrical.codidact.com/posts/284816) and [voltage bars](https://electrical.codidact.com/posts/284860), I finally came to the conclusion that content was more important than form... and I began to draw circuit diagrams with superimposed voltage pictures by hand. For example, in the [Wikibooks story about Ohm's experiment](https://en.wikibooks.org/wiki/Circuit_Idea/Walking_along_the_Resistive_Film), I have drawn the voltage diagrams by color fiber pens on a white sheet of paper. Here is an example of a _voltage divider_ with constant input voltage V...
- 
- ... and of a _resistor summer_ with oppositely varying input voltages Vin1 and Vin2 (an illustration of an op-amp voltage inverter):
- 
- Voltage diagrams vs voltage bars
- --------------------------------
- What do voltage diagrams actually represent compared with voltage bars? The voltage diagram is a further development of the voltage bar representation. Voltage bars are a one-dimensional way of representing voltages while the voltage diagram is a two-dimensional way. The voltage diagram is a set of voltage bars.
- The voltage diagram is based on a linearly distributed resistance along the length of the resistor. In most cases this representation is artificial, because ordinary resistors in electronic circuits are discrete; but it allows to illustrate the circuit operation with voltage diagram. In many cases, quantitative parameters (transfer ratios, etc.) can be directly seen.
- What is the difference between a voltage diagram and voltage oscillogram at a given point in the diagram? The difference is significant, they have nothing in common. The voltage diagram shows voltage distribution along a resistance film, ie what local voltages inside a resistor are. The resistor is considered not as a "point" (without dimensions) but as a "line" (at each point of this line, in a certain step, a section perpendicular to the line is drawn, with a height proportional to the voltage at this point).
- An oscillogram is a set of points that represent voltages (by a vertical displacement) at successive points in time through. So, the particular segments of a voltage diagram represent the voltages at particular points of the resistive layer at the same time while the oscillogram shows the voltages at one point but at different points in time.
- Helping the online learning
- ---------------------------
- As I have said in the stories about [current loops](https://electrical.codidact.com/posts/284816) and [voltage bars](https://electrical.codidact.com/posts/284860), a year ago, when we switched to online learning, I started using the ZOOM pen to draw on existing web circuit diagrams. This turned out to be a very powerful didactic technique that I managed to improve even more on the last exercise. I will show you how this happened at the final part of the last exercise (11.11.21) on Semiconductor Devices with group 49a, ITI, FCST of Technical University of Sofia. I make full video recordings of ZOOM meetings with my students and, with their permission, I will use a link to the [latest record](https://photos.app.goo.gl/bGLcshsiVdYn4WhS6) (in Bulgarian). Here is also a snapshot of ZOOM whiteborad (really, the picture is not so beautiful... but attractive:-)
- 
- In another snapshot, I have drawn the Ohm's triangle on the resistive wire (the vertical leg is the voltage V, the horizontal leg is the resistance R, and the angle between the hypotenuse and the horizontal leg represents the current I):
- 
- It will be interesting for me to know your opinion about this didactic technique.
- Need to visualize voltage distribution
- --------------------------------------
- Once visualized the [voltages at the internal circuit points](https://electrical.codidact.com/posts/284860), we can go even further and "enter" inside resistors to visualize the voltages along the resistive film. This will allow us to see some interesting points (for example, virtual ground), the operation of well-known electrical devices (potentiometer, resistive summer) and electronic circuits (inverting, non-inverting, differential and instrumentation amplifiers).
- First ideas
- -----------
- This idea came to me in the early 90's. Then, for the purposes of intuitive understanding, I began representing local voltages inside resistors by a set of vertical segments whose length (height) was proportional to the local voltage magnitude (I named it _voltage diagram_). This notion of voltage came from a [hydraulic analogy](https://en.wikibooks.org/wiki/Circuit_Idea/Walking_along_the_Resistive_Film#Hydraulic_analogy:_Pressure_diagram) (a garden hose with evenly drilled holes) which I had seen in an old Electrical Engineering textbook. See, for example, an yellowed sheet of paper from my archive where, in 1990, I drew the voltage diagram of a resistor voltage summer:
- 
- It is more convenient to display only the shell of the diagram. Thus a triangle is obtained in which the vertical leg is the voltage V, the horizontal leg is the resistance R, and the angle between the hypotenuse and the horizontal leg represents the current I (another geometric representation of Ohm's law, see the Flash picture below).
- I developed [various kinds of voltage diagrams](https://photos.app.goo.gl/aeQJAx4sqDEYDdtN8). I colored them in red (an association with pressure) to easily distinguish them from circuit diagrams drawn in black.
- Sophisticated voltage diagrams
- ------------------------------
- Later, I drew more sophisticated voltage pictures by means of Corel Draw. See, for example, the circuit of a _voltage divider_ with constant input voltage VREF (applied from the left)...
- 
- ... and of a voltage divider with varying (from the right) input voltage Vin2 (I made them in the late 90's):
- 
- "Live" voltage diagrams
- -----------------------
- In 2000, I made [Flash animated circuit tutorials](https://www.circuit-fantasia.com/collections/circuit-collection/circuits/old-circuits/v-to-i-old.html) with "live"voltage diagrams that were changing proportionally to the voltage magnitude (you need [Ruffle Flash emulator](https://www.blogger.com/blog/post/edit/6662876180507761501/8403863750906537047#) to see this movie because Adobe Flash player is no longer supported).
- 
- "Really live" voltage diagrams
- ----------------------------
- But then I had the desire to make "really live" voltage diagrams that use actually measured voltages at several base points in the circuit. For this purpose, I used MICROLAB data acquisition system (see the [Wikibooks story about Ohm's experiment](https://en.wikibooks.org/wiki/Circuit_Idea/Walking_along_the_Resistive_Film#How_to_visualize_the_voltage_diagram_on_the_screen) and the detailed 5 min [movie](https://photos.app.goo.gl/TDUKTRKeNPoc4mMC7)). In this attractive experiment, a linear potentiometer was supplied by two DACs and the voltages of its three terminals (E1 of the left end, E2 of the right end and E3 of the wiper) were measured by three ADC inputs. The other points of the voltage diagram were calculated. Also, conventional voltmeters were connected:
- 
- When E1 and E2 had opposite polarities, the famous _virtual ground_ appeared:
- 
- The content is more important than form
- ---------------------------------------
- But, as in the case of [current loops](https://electrical.codidact.com/posts/284816) and [voltage bars](https://electrical.codidact.com/posts/284860), I finally came to the conclusion that content was more important than form... and I began to draw circuit diagrams with superimposed voltage pictures by hand. For example, in the [Wikibooks story about Ohm's experiment](https://en.wikibooks.org/wiki/Circuit_Idea/Walking_along_the_Resistive_Film), I have drawn the voltage diagrams by color fiber pens on a white sheet of paper. Here is an example of a _voltage divider_ with constant input voltage V...
- 
- ... and of a _resistor summer_ with oppositely varying input voltages Vin1 and Vin2 (an illustration of an op-amp voltage inverter):
- 
- Voltage diagrams vs voltage bars
- --------------------------------
- What do voltage diagrams actually represent compared with voltage bars? The voltage diagram is a further development of the voltage bar representation. Voltage bars are a one-dimensional way of representing voltages while the voltage diagram is a two-dimensional way. The voltage diagram is a set of voltage bars.
- The voltage diagram is based on a linearly distributed resistance along the length of the resistor. In most cases this representation is artificial, because ordinary resistors in electronic circuits are discrete; but it allows to illustrate the circuit operation with voltage diagram. In many cases, quantitative parameters (transfer ratios, etc.) can be directly seen.
- Voltage diagrams vs oscillograms
- --------------------------------
- What is the difference between a voltage diagram and voltage oscillogram at a given point in the diagram? The difference is significant, they have nothing in common. The voltage diagram shows voltage distribution along a resistance film, ie what local voltages inside a resistor are. The resistor is considered not as a "point" (without dimensions) but as a "line" (at each point of this line, in a certain step, a section perpendicular to the line is drawn, with a height proportional to the voltage at this point).
- An oscillogram is a set of points that represent voltages (by a vertical displacement) at successive points in time through. So, the particular segments of a voltage diagram represent the voltages at particular points of the resistive layer at the same time while the oscillogram shows the voltages at one point but at different points in time.
- Helping the online learning
- ---------------------------
- As I have said in the stories about [current loops](https://electrical.codidact.com/posts/284816) and [voltage bars](https://electrical.codidact.com/posts/284860), a year ago, when we switched to online learning, I started using the ZOOM pen to draw on existing web circuit diagrams. This turned out to be a very powerful didactic technique that I managed to improve even more on the last exercise. I will show you how this happened at the final part of the last exercise (11.11.21) on Semiconductor Devices with group 49a, ITI, FCST of Technical University of Sofia. I make full video recordings of ZOOM meetings with my students and, with their permission, I will use a link to the [latest record](https://photos.app.goo.gl/bGLcshsiVdYn4WhS6) (in Bulgarian). Here is also a snapshot of ZOOM whiteborad (really, the picture is not so beautiful... but attractive:-)
- 
- In another snapshot, I have drawn the Ohm's triangle on the resistive wire (the vertical leg is the voltage V, the horizontal leg is the resistance R, and the angle between the hypotenuse and the horizontal leg represents the current I):
- 
- It will be interesting for me to know your opinion about this didactic technique.
#14: Post edited
by
Circuit fantasist
·
2022-03-29T18:48:49Z (about 3 years ago)
Italicized name
- Need to visualize voltage distribution
- --------------------------------------
- Once visualized the [voltages at the internal circuit points](https://electrical.codidact.com/posts/284860), we can go even further and "enter" inside resistors to visualize the voltages along the resistive film. This will allow us to see some interesting points (for example, virtual ground), the operation of well-known electrical devices (potentiometer, resistive summer) and electronic circuits (inverting, non-inverting, differential and instrumentation amplifiers).
- First ideas
- -----------
This idea came to me in the early 90's. Then, for the purposes of intuitive understanding, I began representing local voltages inside resistors by a set of vertical segments whose length (height) was proportional to the local voltage magnitude (I named it voltage diagram). This notion of voltage came from a [hydraulic analogy](https://en.wikibooks.org/wiki/Circuit_Idea/Walking_along_the_Resistive_Film#Hydraulic_analogy:_Pressure_diagram) (a garden hose with evenly drilled holes) which I had seen in an old Electrical Engineering textbook. See, for example, an yellowed sheet of paper from my archive where, in 1990, I drew the voltage diagram of a resistor voltage summer:- 
- It is more convenient to display only the shell of the diagram. Thus a triangle is obtained in which the vertical leg is the voltage V, the horizontal leg is the resistance R, and the angle between the hypotenuse and the horizontal leg represents the current I (another geometric representation of Ohm's law, see the Flash picture below).
- I developed [various kinds of voltage diagrams](https://photos.app.goo.gl/aeQJAx4sqDEYDdtN8). I colored them in red (an association with pressure) to easily distinguish them from circuit diagrams drawn in black.
- Sophisticated voltage diagrams
- ------------------------------
- Later, I drew more sophisticated voltage pictures by means of Corel Draw. See, for example, the circuit of a _voltage divider_ with constant input voltage VREF (applied from the left)...
- 
- ... and of a voltage divider with varying (from the right) input voltage Vin2 (I made them in the late 90's):
- 
- "Live" voltage diagrams
- -----------------------
- In 2000, I made [Flash animated circuit tutorials](https://www.circuit-fantasia.com/collections/circuit-collection/circuits/old-circuits/v-to-i-old.html) with "live"voltage diagrams that were changing proportionally to the voltage magnitude (you need [Ruffle Flash emulator](https://www.blogger.com/blog/post/edit/6662876180507761501/8403863750906537047#) to see this movie because Adobe Flash player is no longer supported).
- 
- "Really live" voltage diagrams
- ----------------------------
- But then I had the desire to make "really live" voltage diagrams that use actually measured voltages at several base points in the circuit. For this purpose, I used MICROLAB data acquisition system (see the [Wikibooks story about Ohm's experiment](https://en.wikibooks.org/wiki/Circuit_Idea/Walking_along_the_Resistive_Film#How_to_visualize_the_voltage_diagram_on_the_screen) and the detailed 5 min [movie](https://photos.app.goo.gl/TDUKTRKeNPoc4mMC7)). In this attractive experiment, a linear potentiometer was supplied by two DACs and the voltages of its three terminals (E1 of the left end, E2 of the right end and E3 of the wiper) were measured by three ADC inputs. The other points of the voltage diagram were calculated. Also, conventional voltmeters were connected:
- 
- When E1 and E2 had opposite polarities, the famous _virtual ground_ appeared:
- 
- The content is more important than form
- ---------------------------------------
- But, as in the case of [current loops](https://electrical.codidact.com/posts/284816) and [voltage bars](https://electrical.codidact.com/posts/284860), I finally came to the conclusion that content was more important than form... and I began to draw circuit diagrams with superimposed voltage pictures by hand. For example, in the [Wikibooks story about Ohm's experiment](https://en.wikibooks.org/wiki/Circuit_Idea/Walking_along_the_Resistive_Film), I have drawn the voltage diagrams by color fiber pens on a white sheet of paper. Here is an example of a _voltage divider_ with constant input voltage V...
- 
- ... and of a _resistor summer_ with oppositely varying input voltages Vin1 and Vin2 (an illustration of an op-amp voltage inverter):
- 
- Voltage diagrams vs voltage bars
- --------------------------------
- What do voltage diagrams actually represent compared with voltage bars? The voltage diagram is a further development of the voltage bar representation. Voltage bars are a one-dimensional way of representing voltages while the voltage diagram is a two-dimensional way. The voltage diagram is a set of voltage bars.
- The voltage diagram is based on a linearly distributed resistance along the length of the resistor. In most cases this representation is artificial, because ordinary resistors in electronic circuits are discrete; but it allows to illustrate the circuit operation with voltage diagram. In many cases, quantitative parameters (transfer ratios, etc.) can be directly seen.
- What is the difference between a voltage diagram and voltage oscillogram at a given point in the diagram? The difference is significant, they have nothing in common. The voltage diagram shows voltage distribution along a resistance film, ie what local voltages inside a resistor are. The resistor is considered not as a "point" (without dimensions) but as a "line" (at each point of this line, in a certain step, a section perpendicular to the line is drawn, with a height proportional to the voltage at this point).
- An oscillogram is a set of points that represent voltages (by a vertical displacement) at successive points in time through. So, the particular segments of a voltage diagram represent the voltages at particular points of the resistive layer at the same time while the oscillogram shows the voltages at one point but at different points in time.
- Helping the online learning
- ---------------------------
- As I have said in the stories about [current loops](https://electrical.codidact.com/posts/284816) and [voltage bars](https://electrical.codidact.com/posts/284860), a year ago, when we switched to online learning, I started using the ZOOM pen to draw on existing web circuit diagrams. This turned out to be a very powerful didactic technique that I managed to improve even more on the last exercise. I will show you how this happened at the final part of the last exercise (11.11.21) on Semiconductor Devices with group 49a, ITI, FCST of Technical University of Sofia. I make full video recordings of ZOOM meetings with my students and, with their permission, I will use a link to the [latest record](https://photos.app.goo.gl/bGLcshsiVdYn4WhS6) (in Bulgarian). Here is also a snapshot of ZOOM whiteborad (really, the picture is not so beautiful... but attractive:-)
- 
- In another snapshot, I have drawn the Ohm's triangle on the resistive wire (the vertical leg is the voltage V, the horizontal leg is the resistance R, and the angle between the hypotenuse and the horizontal leg represents the current I):
- 
- It will be interesting for me to know your opinion about this didactic technique.
- Need to visualize voltage distribution
- --------------------------------------
- Once visualized the [voltages at the internal circuit points](https://electrical.codidact.com/posts/284860), we can go even further and "enter" inside resistors to visualize the voltages along the resistive film. This will allow us to see some interesting points (for example, virtual ground), the operation of well-known electrical devices (potentiometer, resistive summer) and electronic circuits (inverting, non-inverting, differential and instrumentation amplifiers).
- First ideas
- -----------
- This idea came to me in the early 90's. Then, for the purposes of intuitive understanding, I began representing local voltages inside resistors by a set of vertical segments whose length (height) was proportional to the local voltage magnitude (I named it _voltage diagram_). This notion of voltage came from a [hydraulic analogy](https://en.wikibooks.org/wiki/Circuit_Idea/Walking_along_the_Resistive_Film#Hydraulic_analogy:_Pressure_diagram) (a garden hose with evenly drilled holes) which I had seen in an old Electrical Engineering textbook. See, for example, an yellowed sheet of paper from my archive where, in 1990, I drew the voltage diagram of a resistor voltage summer:
- 
- It is more convenient to display only the shell of the diagram. Thus a triangle is obtained in which the vertical leg is the voltage V, the horizontal leg is the resistance R, and the angle between the hypotenuse and the horizontal leg represents the current I (another geometric representation of Ohm's law, see the Flash picture below).
- I developed [various kinds of voltage diagrams](https://photos.app.goo.gl/aeQJAx4sqDEYDdtN8). I colored them in red (an association with pressure) to easily distinguish them from circuit diagrams drawn in black.
- Sophisticated voltage diagrams
- ------------------------------
- Later, I drew more sophisticated voltage pictures by means of Corel Draw. See, for example, the circuit of a _voltage divider_ with constant input voltage VREF (applied from the left)...
- 
- ... and of a voltage divider with varying (from the right) input voltage Vin2 (I made them in the late 90's):
- 
- "Live" voltage diagrams
- -----------------------
- In 2000, I made [Flash animated circuit tutorials](https://www.circuit-fantasia.com/collections/circuit-collection/circuits/old-circuits/v-to-i-old.html) with "live"voltage diagrams that were changing proportionally to the voltage magnitude (you need [Ruffle Flash emulator](https://www.blogger.com/blog/post/edit/6662876180507761501/8403863750906537047#) to see this movie because Adobe Flash player is no longer supported).
- 
- "Really live" voltage diagrams
- ----------------------------
- But then I had the desire to make "really live" voltage diagrams that use actually measured voltages at several base points in the circuit. For this purpose, I used MICROLAB data acquisition system (see the [Wikibooks story about Ohm's experiment](https://en.wikibooks.org/wiki/Circuit_Idea/Walking_along_the_Resistive_Film#How_to_visualize_the_voltage_diagram_on_the_screen) and the detailed 5 min [movie](https://photos.app.goo.gl/TDUKTRKeNPoc4mMC7)). In this attractive experiment, a linear potentiometer was supplied by two DACs and the voltages of its three terminals (E1 of the left end, E2 of the right end and E3 of the wiper) were measured by three ADC inputs. The other points of the voltage diagram were calculated. Also, conventional voltmeters were connected:
- 
- When E1 and E2 had opposite polarities, the famous _virtual ground_ appeared:
- 
- The content is more important than form
- ---------------------------------------
- But, as in the case of [current loops](https://electrical.codidact.com/posts/284816) and [voltage bars](https://electrical.codidact.com/posts/284860), I finally came to the conclusion that content was more important than form... and I began to draw circuit diagrams with superimposed voltage pictures by hand. For example, in the [Wikibooks story about Ohm's experiment](https://en.wikibooks.org/wiki/Circuit_Idea/Walking_along_the_Resistive_Film), I have drawn the voltage diagrams by color fiber pens on a white sheet of paper. Here is an example of a _voltage divider_ with constant input voltage V...
- 
- ... and of a _resistor summer_ with oppositely varying input voltages Vin1 and Vin2 (an illustration of an op-amp voltage inverter):
- 
- Voltage diagrams vs voltage bars
- --------------------------------
- What do voltage diagrams actually represent compared with voltage bars? The voltage diagram is a further development of the voltage bar representation. Voltage bars are a one-dimensional way of representing voltages while the voltage diagram is a two-dimensional way. The voltage diagram is a set of voltage bars.
- The voltage diagram is based on a linearly distributed resistance along the length of the resistor. In most cases this representation is artificial, because ordinary resistors in electronic circuits are discrete; but it allows to illustrate the circuit operation with voltage diagram. In many cases, quantitative parameters (transfer ratios, etc.) can be directly seen.
- What is the difference between a voltage diagram and voltage oscillogram at a given point in the diagram? The difference is significant, they have nothing in common. The voltage diagram shows voltage distribution along a resistance film, ie what local voltages inside a resistor are. The resistor is considered not as a "point" (without dimensions) but as a "line" (at each point of this line, in a certain step, a section perpendicular to the line is drawn, with a height proportional to the voltage at this point).
- An oscillogram is a set of points that represent voltages (by a vertical displacement) at successive points in time through. So, the particular segments of a voltage diagram represent the voltages at particular points of the resistive layer at the same time while the oscillogram shows the voltages at one point but at different points in time.
- Helping the online learning
- ---------------------------
- As I have said in the stories about [current loops](https://electrical.codidact.com/posts/284816) and [voltage bars](https://electrical.codidact.com/posts/284860), a year ago, when we switched to online learning, I started using the ZOOM pen to draw on existing web circuit diagrams. This turned out to be a very powerful didactic technique that I managed to improve even more on the last exercise. I will show you how this happened at the final part of the last exercise (11.11.21) on Semiconductor Devices with group 49a, ITI, FCST of Technical University of Sofia. I make full video recordings of ZOOM meetings with my students and, with their permission, I will use a link to the [latest record](https://photos.app.goo.gl/bGLcshsiVdYn4WhS6) (in Bulgarian). Here is also a snapshot of ZOOM whiteborad (really, the picture is not so beautiful... but attractive:-)
- 
- In another snapshot, I have drawn the Ohm's triangle on the resistive wire (the vertical leg is the voltage V, the horizontal leg is the resistance R, and the angle between the hypotenuse and the horizontal leg represents the current I):
- 
- It will be interesting for me to know your opinion about this didactic technique.
#13: Post edited
by
Circuit fantasist
·
2021-12-18T15:04:01Z (over 3 years ago)
Minor edit
- Need to visualize voltage distribution
- --------------------------------------
- Once visualized the [voltages at the internal circuit points](https://electrical.codidact.com/posts/284860), we can go even further and "enter" inside resistors to visualize the voltages along the resistive film. This will allow us to see some interesting points (for example, virtual ground), the operation of well-known electrical devices (potentiometer, resistive summer) and electronic circuits (inverting, non-inverting, differential and instrumentation amplifiers).
- First ideas
- -----------
- This idea came to me in the early 90's. Then, for the purposes of intuitive understanding, I began representing local voltages inside resistors by a set of vertical segments whose length (height) was proportional to the local voltage magnitude (I named it voltage diagram). This notion of voltage came from a [hydraulic analogy](https://en.wikibooks.org/wiki/Circuit_Idea/Walking_along_the_Resistive_Film#Hydraulic_analogy:_Pressure_diagram) (a garden hose with evenly drilled holes) which I had seen in an old Electrical Engineering textbook. See, for example, an yellowed sheet of paper from my archive where, in 1990, I drew the voltage diagram of a resistor voltage summer:
- 
- It is more convenient to display only the shell of the diagram. Thus a triangle is obtained in which the vertical leg is the voltage V, the horizontal leg is the resistance R, and the angle between the hypotenuse and the horizontal leg represents the current I (another geometric representation of Ohm's law, see the Flash picture below).
I have developed [various kinds of voltage diagrams](https://photos.app.goo.gl/aeQJAx4sqDEYDdtN8). I colored them in red (an association with pressure) to easily distinguish them from circuit diagrams drawn in black.- Sophisticated voltage diagrams
- ------------------------------
- Later, I drew more sophisticated voltage pictures by means of Corel Draw. See, for example, the circuit of a _voltage divider_ with constant input voltage VREF (applied from the left)...
- 
- ... and of a voltage divider with varying (from the right) input voltage Vin2 (I made them in the late 90's):
- 
- "Live" voltage diagrams
- -----------------------
- In 2000, I made [Flash animated circuit tutorials](https://www.circuit-fantasia.com/collections/circuit-collection/circuits/old-circuits/v-to-i-old.html) with "live"voltage diagrams that were changing proportionally to the voltage magnitude (you need [Ruffle Flash emulator](https://www.blogger.com/blog/post/edit/6662876180507761501/8403863750906537047#) to see this movie because Adobe Flash player is no longer supported).
- 
- "Really live" voltage diagrams
- ----------------------------
- But then I had the desire to make "really live" voltage diagrams that use actually measured voltages at several base points in the circuit. For this purpose, I used MICROLAB data acquisition system (see the [Wikibooks story about Ohm's experiment](https://en.wikibooks.org/wiki/Circuit_Idea/Walking_along_the_Resistive_Film#How_to_visualize_the_voltage_diagram_on_the_screen) and the detailed 5 min [movie](https://photos.app.goo.gl/TDUKTRKeNPoc4mMC7)). In this attractive experiment, a linear potentiometer was supplied by two DACs and the voltages of its three terminals (E1 of the left end, E2 of the right end and E3 of the wiper) were measured by three ADC inputs. The other points of the voltage diagram were calculated. Also, conventional voltmeters were connected:
- 
- When E1 and E2 had opposite polarities, the famous _virtual ground_ appeared:
- 
- The content is more important than form
- ---------------------------------------
- But, as in the case of [current loops](https://electrical.codidact.com/posts/284816) and [voltage bars](https://electrical.codidact.com/posts/284860), I finally came to the conclusion that content was more important than form... and I began to draw circuit diagrams with superimposed voltage pictures by hand. For example, in the [Wikibooks story about Ohm's experiment](https://en.wikibooks.org/wiki/Circuit_Idea/Walking_along_the_Resistive_Film), I have drawn the voltage diagrams by color fiber pens on a white sheet of paper. Here is an example of a _voltage divider_ with constant input voltage V...
- 
- ... and of a _resistor summer_ with oppositely varying input voltages Vin1 and Vin2 (an illustration of an op-amp voltage inverter):
- 
- Voltage diagrams vs voltage bars
- --------------------------------
- What do voltage diagrams actually represent compared with voltage bars? The voltage diagram is a further development of the voltage bar representation. Voltage bars are a one-dimensional way of representing voltages while the voltage diagram is a two-dimensional way. The voltage diagram is a set of voltage bars.
- The voltage diagram is based on a linearly distributed resistance along the length of the resistor. In most cases this representation is artificial, because ordinary resistors in electronic circuits are discrete; but it allows to illustrate the circuit operation with voltage diagram. In many cases, quantitative parameters (transfer ratios, etc.) can be directly seen.
- What is the difference between a voltage diagram and voltage oscillogram at a given point in the diagram? The difference is significant, they have nothing in common. The voltage diagram shows voltage distribution along a resistance film, ie what local voltages inside a resistor are. The resistor is considered not as a "point" (without dimensions) but as a "line" (at each point of this line, in a certain step, a section perpendicular to the line is drawn, with a height proportional to the voltage at this point).
- An oscillogram is a set of points that represent voltages (by a vertical displacement) at successive points in time through. So, the particular segments of a voltage diagram represent the voltages at particular points of the resistive layer at the same time while the oscillogram shows the voltages at one point but at different points in time.
- Helping the online learning
- ---------------------------
- As I have said in the stories about [current loops](https://electrical.codidact.com/posts/284816) and [voltage bars](https://electrical.codidact.com/posts/284860), a year ago, when we switched to online learning, I started using the ZOOM pen to draw on existing web circuit diagrams. This turned out to be a very powerful didactic technique that I managed to improve even more on the last exercise. I will show you how this happened at the final part of the last exercise (11.11.21) on Semiconductor Devices with group 49a, ITI, FCST of Technical University of Sofia. I make full video recordings of ZOOM meetings with my students and, with their permission, I will use a link to the [latest record](https://photos.app.goo.gl/bGLcshsiVdYn4WhS6) (in Bulgarian). Here is also a snapshot of ZOOM whiteborad (really, the picture is not so beautiful... but attractive:-)
- 
- In another snapshot, I have drawn the Ohm's triangle on the resistive wire (the vertical leg is the voltage V, the horizontal leg is the resistance R, and the angle between the hypotenuse and the horizontal leg represents the current I):
- 
- It will be interesting for me to know your opinion about this didactic technique.
- Need to visualize voltage distribution
- --------------------------------------
- Once visualized the [voltages at the internal circuit points](https://electrical.codidact.com/posts/284860), we can go even further and "enter" inside resistors to visualize the voltages along the resistive film. This will allow us to see some interesting points (for example, virtual ground), the operation of well-known electrical devices (potentiometer, resistive summer) and electronic circuits (inverting, non-inverting, differential and instrumentation amplifiers).
- First ideas
- -----------
- This idea came to me in the early 90's. Then, for the purposes of intuitive understanding, I began representing local voltages inside resistors by a set of vertical segments whose length (height) was proportional to the local voltage magnitude (I named it voltage diagram). This notion of voltage came from a [hydraulic analogy](https://en.wikibooks.org/wiki/Circuit_Idea/Walking_along_the_Resistive_Film#Hydraulic_analogy:_Pressure_diagram) (a garden hose with evenly drilled holes) which I had seen in an old Electrical Engineering textbook. See, for example, an yellowed sheet of paper from my archive where, in 1990, I drew the voltage diagram of a resistor voltage summer:
- 
- It is more convenient to display only the shell of the diagram. Thus a triangle is obtained in which the vertical leg is the voltage V, the horizontal leg is the resistance R, and the angle between the hypotenuse and the horizontal leg represents the current I (another geometric representation of Ohm's law, see the Flash picture below).
- I developed [various kinds of voltage diagrams](https://photos.app.goo.gl/aeQJAx4sqDEYDdtN8). I colored them in red (an association with pressure) to easily distinguish them from circuit diagrams drawn in black.
- Sophisticated voltage diagrams
- ------------------------------
- Later, I drew more sophisticated voltage pictures by means of Corel Draw. See, for example, the circuit of a _voltage divider_ with constant input voltage VREF (applied from the left)...
- 
- ... and of a voltage divider with varying (from the right) input voltage Vin2 (I made them in the late 90's):
- 
- "Live" voltage diagrams
- -----------------------
- In 2000, I made [Flash animated circuit tutorials](https://www.circuit-fantasia.com/collections/circuit-collection/circuits/old-circuits/v-to-i-old.html) with "live"voltage diagrams that were changing proportionally to the voltage magnitude (you need [Ruffle Flash emulator](https://www.blogger.com/blog/post/edit/6662876180507761501/8403863750906537047#) to see this movie because Adobe Flash player is no longer supported).
- 
- "Really live" voltage diagrams
- ----------------------------
- But then I had the desire to make "really live" voltage diagrams that use actually measured voltages at several base points in the circuit. For this purpose, I used MICROLAB data acquisition system (see the [Wikibooks story about Ohm's experiment](https://en.wikibooks.org/wiki/Circuit_Idea/Walking_along_the_Resistive_Film#How_to_visualize_the_voltage_diagram_on_the_screen) and the detailed 5 min [movie](https://photos.app.goo.gl/TDUKTRKeNPoc4mMC7)). In this attractive experiment, a linear potentiometer was supplied by two DACs and the voltages of its three terminals (E1 of the left end, E2 of the right end and E3 of the wiper) were measured by three ADC inputs. The other points of the voltage diagram were calculated. Also, conventional voltmeters were connected:
- 
- When E1 and E2 had opposite polarities, the famous _virtual ground_ appeared:
- 
- The content is more important than form
- ---------------------------------------
- But, as in the case of [current loops](https://electrical.codidact.com/posts/284816) and [voltage bars](https://electrical.codidact.com/posts/284860), I finally came to the conclusion that content was more important than form... and I began to draw circuit diagrams with superimposed voltage pictures by hand. For example, in the [Wikibooks story about Ohm's experiment](https://en.wikibooks.org/wiki/Circuit_Idea/Walking_along_the_Resistive_Film), I have drawn the voltage diagrams by color fiber pens on a white sheet of paper. Here is an example of a _voltage divider_ with constant input voltage V...
- 
- ... and of a _resistor summer_ with oppositely varying input voltages Vin1 and Vin2 (an illustration of an op-amp voltage inverter):
- 
- Voltage diagrams vs voltage bars
- --------------------------------
- What do voltage diagrams actually represent compared with voltage bars? The voltage diagram is a further development of the voltage bar representation. Voltage bars are a one-dimensional way of representing voltages while the voltage diagram is a two-dimensional way. The voltage diagram is a set of voltage bars.
- The voltage diagram is based on a linearly distributed resistance along the length of the resistor. In most cases this representation is artificial, because ordinary resistors in electronic circuits are discrete; but it allows to illustrate the circuit operation with voltage diagram. In many cases, quantitative parameters (transfer ratios, etc.) can be directly seen.
- What is the difference between a voltage diagram and voltage oscillogram at a given point in the diagram? The difference is significant, they have nothing in common. The voltage diagram shows voltage distribution along a resistance film, ie what local voltages inside a resistor are. The resistor is considered not as a "point" (without dimensions) but as a "line" (at each point of this line, in a certain step, a section perpendicular to the line is drawn, with a height proportional to the voltage at this point).
- An oscillogram is a set of points that represent voltages (by a vertical displacement) at successive points in time through. So, the particular segments of a voltage diagram represent the voltages at particular points of the resistive layer at the same time while the oscillogram shows the voltages at one point but at different points in time.
- Helping the online learning
- ---------------------------
- As I have said in the stories about [current loops](https://electrical.codidact.com/posts/284816) and [voltage bars](https://electrical.codidact.com/posts/284860), a year ago, when we switched to online learning, I started using the ZOOM pen to draw on existing web circuit diagrams. This turned out to be a very powerful didactic technique that I managed to improve even more on the last exercise. I will show you how this happened at the final part of the last exercise (11.11.21) on Semiconductor Devices with group 49a, ITI, FCST of Technical University of Sofia. I make full video recordings of ZOOM meetings with my students and, with their permission, I will use a link to the [latest record](https://photos.app.goo.gl/bGLcshsiVdYn4WhS6) (in Bulgarian). Here is also a snapshot of ZOOM whiteborad (really, the picture is not so beautiful... but attractive:-)
- 
- In another snapshot, I have drawn the Ohm's triangle on the resistive wire (the vertical leg is the voltage V, the horizontal leg is the resistance R, and the angle between the hypotenuse and the horizontal leg represents the current I):
- 
- It will be interesting for me to know your opinion about this didactic technique.
#12: Post edited
by
Circuit fantasist
·
2021-11-16T13:25:35Z (over 3 years ago)
Minor edit
- Need to visualize voltage distribution
- --------------------------------------
- Once visualized the [voltages at the internal circuit points](https://electrical.codidact.com/posts/284860), we can go even further and "enter" inside resistors to visualize the voltages along the resistive film. This will allow us to see some interesting points (for example, virtual ground), the operation of well-known electrical devices (potentiometer, resistive summer) and electronic circuits (inverting, non-inverting, differential and instrumentation amplifiers).
- First ideas
- -----------
- This idea came to me in the early 90's. Then, for the purposes of intuitive understanding, I began representing local voltages inside resistors by a set of vertical segments whose length (height) was proportional to the local voltage magnitude (I named it voltage diagram). This notion of voltage came from a [hydraulic analogy](https://en.wikibooks.org/wiki/Circuit_Idea/Walking_along_the_Resistive_Film#Hydraulic_analogy:_Pressure_diagram) (a garden hose with evenly drilled holes) which I had seen in an old Electrical Engineering textbook. See, for example, an yellowed sheet of paper from my archive where, in 1990, I drew the voltage diagram of a resistor voltage summer:
- 
- It is more convenient to display only the shell of the diagram. Thus a triangle is obtained in which the vertical leg is the voltage V, the horizontal leg is the resistance R, and the angle between the hypotenuse and the horizontal leg represents the current I (another geometric representation of Ohm's law, see the Flash picture below).
- I have developed [various kinds of voltage diagrams](https://photos.app.goo.gl/aeQJAx4sqDEYDdtN8). I colored them in red (an association with pressure) to easily distinguish them from circuit diagrams drawn in black.
- Sophisticated voltage diagrams
- ------------------------------
- Later, I drew more sophisticated voltage pictures by means of Corel Draw. See, for example, the circuit of a _voltage divider_ with constant input voltage VREF (applied from the left)...
- 
- ... and of a voltage divider with varying (from the right) input voltage Vin2 (I made them in the late 90's):
- 
- "Live" voltage diagrams
- -----------------------
- In 2000, I made [Flash animated circuit tutorials](https://www.circuit-fantasia.com/collections/circuit-collection/circuits/old-circuits/v-to-i-old.html) with "live"voltage diagrams that were changing proportionally to the voltage magnitude (you need [Ruffle Flash emulator](https://www.blogger.com/blog/post/edit/6662876180507761501/8403863750906537047#) to see this movie because Adobe Flash player is no longer supported).
- 
- "Really live" voltage diagrams
- ----------------------------
But then I had the desire to make "reallly live" voltage diagrams that use actually measured voltages at several base points in the circuit. For this purpose, I used MICROLAB data acquisition system (see the [Wikibooks story about Ohm's experiment](https://en.wikibooks.org/wiki/Circuit_Idea/Walking_along_the_Resistive_Film#How_to_visualize_the_voltage_diagram_on_the_screen) and the detailed 5 min [movie](https://photos.app.goo.gl/TDUKTRKeNPoc4mMC7)). In this attractive experiment, a linear potentiometer was supplied by two DACs and the voltages of its three terminals (E1 of the left end, E2 of the right end and E3 of the wiper) were measured by three ADC inputs. The other points of the voltage diagram were calculated. Also, conventional voltmeters were connected:- 
- When E1 and E2 had opposite polarities, the famous _virtual ground_ appeared:
- 
- The content is more important than form
- ---------------------------------------
- But, as in the case of [current loops](https://electrical.codidact.com/posts/284816) and [voltage bars](https://electrical.codidact.com/posts/284860), I finally came to the conclusion that content was more important than form... and I began to draw circuit diagrams with superimposed voltage pictures by hand. For example, in the [Wikibooks story about Ohm's experiment](https://en.wikibooks.org/wiki/Circuit_Idea/Walking_along_the_Resistive_Film), I have drawn the voltage diagrams by color fiber pens on a white sheet of paper. Here is an example of a _voltage divider_ with constant input voltage V...
- 
- ... and of a _resistor summer_ with oppositely varying input voltages Vin1 and Vin2 (an illustration of an op-amp voltage inverter):
- 
- Voltage diagrams vs voltage bars
- --------------------------------
- What do voltage diagrams actually represent compared with voltage bars? The voltage diagram is a further development of the voltage bar representation. Voltage bars are a one-dimensional way of representing voltages while the voltage diagram is a two-dimensional way. The voltage diagram is a set of voltage bars.
- The voltage diagram is based on a linearly distributed resistance along the length of the resistor. In most cases this representation is artificial, because ordinary resistors in electronic circuits are discrete; but it allows to illustrate the circuit operation with voltage diagram. In many cases, quantitative parameters (transfer ratios, etc.) can be directly seen.
- What is the difference between a voltage diagram and voltage oscillogram at a given point in the diagram? The difference is significant, they have nothing in common. The voltage diagram shows voltage distribution along a resistance film, ie what local voltages inside a resistor are. The resistor is considered not as a "point" (without dimensions) but as a "line" (at each point of this line, in a certain step, a section perpendicular to the line is drawn, with a height proportional to the voltage at this point).
- An oscillogram is a set of points that represent voltages (by a vertical displacement) at successive points in time through. So, the particular segments of a voltage diagram represent the voltages at particular points of the resistive layer at the same time while the oscillogram shows the voltages at one point but at different points in time.
- Helping the online learning
- ---------------------------
- As I have said in the stories about [current loops](https://electrical.codidact.com/posts/284816) and [voltage bars](https://electrical.codidact.com/posts/284860), a year ago, when we switched to online learning, I started using the ZOOM pen to draw on existing web circuit diagrams. This turned out to be a very powerful didactic technique that I managed to improve even more on the last exercise. I will show you how this happened at the final part of the last exercise (11.11.21) on Semiconductor Devices with group 49a, ITI, FCST of Technical University of Sofia. I make full video recordings of ZOOM meetings with my students and, with their permission, I will use a link to the [latest record](https://photos.app.goo.gl/bGLcshsiVdYn4WhS6) (in Bulgarian). Here is also a snapshot of ZOOM whiteborad (really, the picture is not so beautiful... but attractive:-)
- 
- In another snapshot, I have drawn the Ohm's triangle on the resistive wire (the vertical leg is the voltage V, the horizontal leg is the resistance R, and the angle between the hypotenuse and the horizontal leg represents the current I):
- 
- It will be interesting for me to know your opinion about this didactic technique.
- Need to visualize voltage distribution
- --------------------------------------
- Once visualized the [voltages at the internal circuit points](https://electrical.codidact.com/posts/284860), we can go even further and "enter" inside resistors to visualize the voltages along the resistive film. This will allow us to see some interesting points (for example, virtual ground), the operation of well-known electrical devices (potentiometer, resistive summer) and electronic circuits (inverting, non-inverting, differential and instrumentation amplifiers).
- First ideas
- -----------
- This idea came to me in the early 90's. Then, for the purposes of intuitive understanding, I began representing local voltages inside resistors by a set of vertical segments whose length (height) was proportional to the local voltage magnitude (I named it voltage diagram). This notion of voltage came from a [hydraulic analogy](https://en.wikibooks.org/wiki/Circuit_Idea/Walking_along_the_Resistive_Film#Hydraulic_analogy:_Pressure_diagram) (a garden hose with evenly drilled holes) which I had seen in an old Electrical Engineering textbook. See, for example, an yellowed sheet of paper from my archive where, in 1990, I drew the voltage diagram of a resistor voltage summer:
- 
- It is more convenient to display only the shell of the diagram. Thus a triangle is obtained in which the vertical leg is the voltage V, the horizontal leg is the resistance R, and the angle between the hypotenuse and the horizontal leg represents the current I (another geometric representation of Ohm's law, see the Flash picture below).
- I have developed [various kinds of voltage diagrams](https://photos.app.goo.gl/aeQJAx4sqDEYDdtN8). I colored them in red (an association with pressure) to easily distinguish them from circuit diagrams drawn in black.
- Sophisticated voltage diagrams
- ------------------------------
- Later, I drew more sophisticated voltage pictures by means of Corel Draw. See, for example, the circuit of a _voltage divider_ with constant input voltage VREF (applied from the left)...
- 
- ... and of a voltage divider with varying (from the right) input voltage Vin2 (I made them in the late 90's):
- 
- "Live" voltage diagrams
- -----------------------
- In 2000, I made [Flash animated circuit tutorials](https://www.circuit-fantasia.com/collections/circuit-collection/circuits/old-circuits/v-to-i-old.html) with "live"voltage diagrams that were changing proportionally to the voltage magnitude (you need [Ruffle Flash emulator](https://www.blogger.com/blog/post/edit/6662876180507761501/8403863750906537047#) to see this movie because Adobe Flash player is no longer supported).
- 
- "Really live" voltage diagrams
- ----------------------------
- But then I had the desire to make "really live" voltage diagrams that use actually measured voltages at several base points in the circuit. For this purpose, I used MICROLAB data acquisition system (see the [Wikibooks story about Ohm's experiment](https://en.wikibooks.org/wiki/Circuit_Idea/Walking_along_the_Resistive_Film#How_to_visualize_the_voltage_diagram_on_the_screen) and the detailed 5 min [movie](https://photos.app.goo.gl/TDUKTRKeNPoc4mMC7)). In this attractive experiment, a linear potentiometer was supplied by two DACs and the voltages of its three terminals (E1 of the left end, E2 of the right end and E3 of the wiper) were measured by three ADC inputs. The other points of the voltage diagram were calculated. Also, conventional voltmeters were connected:
- 
- When E1 and E2 had opposite polarities, the famous _virtual ground_ appeared:
- 
- The content is more important than form
- ---------------------------------------
- But, as in the case of [current loops](https://electrical.codidact.com/posts/284816) and [voltage bars](https://electrical.codidact.com/posts/284860), I finally came to the conclusion that content was more important than form... and I began to draw circuit diagrams with superimposed voltage pictures by hand. For example, in the [Wikibooks story about Ohm's experiment](https://en.wikibooks.org/wiki/Circuit_Idea/Walking_along_the_Resistive_Film), I have drawn the voltage diagrams by color fiber pens on a white sheet of paper. Here is an example of a _voltage divider_ with constant input voltage V...
- 
- ... and of a _resistor summer_ with oppositely varying input voltages Vin1 and Vin2 (an illustration of an op-amp voltage inverter):
- 
- Voltage diagrams vs voltage bars
- --------------------------------
- What do voltage diagrams actually represent compared with voltage bars? The voltage diagram is a further development of the voltage bar representation. Voltage bars are a one-dimensional way of representing voltages while the voltage diagram is a two-dimensional way. The voltage diagram is a set of voltage bars.
- The voltage diagram is based on a linearly distributed resistance along the length of the resistor. In most cases this representation is artificial, because ordinary resistors in electronic circuits are discrete; but it allows to illustrate the circuit operation with voltage diagram. In many cases, quantitative parameters (transfer ratios, etc.) can be directly seen.
- What is the difference between a voltage diagram and voltage oscillogram at a given point in the diagram? The difference is significant, they have nothing in common. The voltage diagram shows voltage distribution along a resistance film, ie what local voltages inside a resistor are. The resistor is considered not as a "point" (without dimensions) but as a "line" (at each point of this line, in a certain step, a section perpendicular to the line is drawn, with a height proportional to the voltage at this point).
- An oscillogram is a set of points that represent voltages (by a vertical displacement) at successive points in time through. So, the particular segments of a voltage diagram represent the voltages at particular points of the resistive layer at the same time while the oscillogram shows the voltages at one point but at different points in time.
- Helping the online learning
- ---------------------------
- As I have said in the stories about [current loops](https://electrical.codidact.com/posts/284816) and [voltage bars](https://electrical.codidact.com/posts/284860), a year ago, when we switched to online learning, I started using the ZOOM pen to draw on existing web circuit diagrams. This turned out to be a very powerful didactic technique that I managed to improve even more on the last exercise. I will show you how this happened at the final part of the last exercise (11.11.21) on Semiconductor Devices with group 49a, ITI, FCST of Technical University of Sofia. I make full video recordings of ZOOM meetings with my students and, with their permission, I will use a link to the [latest record](https://photos.app.goo.gl/bGLcshsiVdYn4WhS6) (in Bulgarian). Here is also a snapshot of ZOOM whiteborad (really, the picture is not so beautiful... but attractive:-)
- 
- In another snapshot, I have drawn the Ohm's triangle on the resistive wire (the vertical leg is the voltage V, the horizontal leg is the resistance R, and the angle between the hypotenuse and the horizontal leg represents the current I):
- 
- It will be interesting for me to know your opinion about this didactic technique.
#11: Post edited
by
Circuit fantasist
·
2021-11-16T13:24:10Z (over 3 years ago)
Minor edit
- Need to visualize voltage distribution
- --------------------------------------
- Once visualized the [voltages at the internal circuit points](https://electrical.codidact.com/posts/284860), we can go even further and "enter" inside resistors to visualize the voltages along the resistive film. This will allow us to see some interesting points (for example, virtual ground), the operation of well-known electrical devices (potentiometer, resistive summer) and electronic circuits (inverting, non-inverting, differential and instrumentation amplifiers).
- First ideas
- -----------
- This idea came to me in the early 90's. Then, for the purposes of intuitive understanding, I began representing local voltages inside resistors by a set of vertical segments whose length (height) was proportional to the local voltage magnitude (I named it voltage diagram). This notion of voltage came from a [hydraulic analogy](https://en.wikibooks.org/wiki/Circuit_Idea/Walking_along_the_Resistive_Film#Hydraulic_analogy:_Pressure_diagram) (a garden hose with evenly drilled holes) which I had seen in an old Electrical Engineering textbook. See, for example, an yellowed sheet of paper from my archive where, in 1990, I drew the voltage diagram of a resistor voltage summer:
- 
- It is more convenient to display only the shell of the diagram. Thus a triangle is obtained in which the vertical leg is the voltage V, the horizontal leg is the resistance R, and the angle between the hypotenuse and the horizontal leg represents the current I (another geometric representation of Ohm's law, see the Flash picture below).
- I have developed [various kinds of voltage diagrams](https://photos.app.goo.gl/aeQJAx4sqDEYDdtN8). I colored them in red (an association with pressure) to easily distinguish them from circuit diagrams drawn in black.
- Sophisticated voltage diagrams
- ------------------------------
- Later, I drew more sophisticated voltage pictures by means of Corel Draw. See, for example, the circuit of a _voltage divider_ with constant input voltage VREF (applied from the left)...
- 
- ... and of a voltage divider with varying (from the right) input voltage Vin2 (I made them in the late 90's):
- 
- "Live" voltage diagrams
- -----------------------
- In 2000, I made [Flash animated circuit tutorials](https://www.circuit-fantasia.com/collections/circuit-collection/circuits/old-circuits/v-to-i-old.html) with "live"voltage diagrams that were changing proportionally to the voltage magnitude (you need [Ruffle Flash emulator](https://www.blogger.com/blog/post/edit/6662876180507761501/8403863750906537047#) to see this movie because Adobe Flash player is no longer supported).
- 
"Reallly live" voltage diagrams- ----------------------------
- But then I had the desire to make "reallly live" voltage diagrams that use actually measured voltages at several base points in the circuit. For this purpose, I used MICROLAB data acquisition system (see the [Wikibooks story about Ohm's experiment](https://en.wikibooks.org/wiki/Circuit_Idea/Walking_along_the_Resistive_Film#How_to_visualize_the_voltage_diagram_on_the_screen) and the detailed 5 min [movie](https://photos.app.goo.gl/TDUKTRKeNPoc4mMC7)). In this attractive experiment, a linear potentiometer was supplied by two DACs and the voltages of its three terminals (E1 of the left end, E2 of the right end and E3 of the wiper) were measured by three ADC inputs. The other points of the voltage diagram were calculated. Also, conventional voltmeters were connected:
- 
- When E1 and E2 had opposite polarities, the famous _virtual ground_ appeared:
- 
- The content is more important than form
- ---------------------------------------
- But, as in the case of [current loops](https://electrical.codidact.com/posts/284816) and [voltage bars](https://electrical.codidact.com/posts/284860), I finally came to the conclusion that content was more important than form... and I began to draw circuit diagrams with superimposed voltage pictures by hand. For example, in the [Wikibooks story about Ohm's experiment](https://en.wikibooks.org/wiki/Circuit_Idea/Walking_along_the_Resistive_Film), I have drawn the voltage diagrams by color fiber pens on a white sheet of paper. Here is an example of a _voltage divider_ with constant input voltage V...
- 
- ... and of a _resistor summer_ with oppositely varying input voltages Vin1 and Vin2 (an illustration of an op-amp voltage inverter):
- 
- Voltage diagrams vs voltage bars
- --------------------------------
- What do voltage diagrams actually represent compared with voltage bars? The voltage diagram is a further development of the voltage bar representation. Voltage bars are a one-dimensional way of representing voltages while the voltage diagram is a two-dimensional way. The voltage diagram is a set of voltage bars.
- The voltage diagram is based on a linearly distributed resistance along the length of the resistor. In most cases this representation is artificial, because ordinary resistors in electronic circuits are discrete; but it allows to illustrate the circuit operation with voltage diagram. In many cases, quantitative parameters (transfer ratios, etc.) can be directly seen.
- What is the difference between a voltage diagram and voltage oscillogram at a given point in the diagram? The difference is significant, they have nothing in common. The voltage diagram shows voltage distribution along a resistance film, ie what local voltages inside a resistor are. The resistor is considered not as a "point" (without dimensions) but as a "line" (at each point of this line, in a certain step, a section perpendicular to the line is drawn, with a height proportional to the voltage at this point).
- An oscillogram is a set of points that represent voltages (by a vertical displacement) at successive points in time through. So, the particular segments of a voltage diagram represent the voltages at particular points of the resistive layer at the same time while the oscillogram shows the voltages at one point but at different points in time.
- Helping the online learning
- ---------------------------
- As I have said in the stories about [current loops](https://electrical.codidact.com/posts/284816) and [voltage bars](https://electrical.codidact.com/posts/284860), a year ago, when we switched to online learning, I started using the ZOOM pen to draw on existing web circuit diagrams. This turned out to be a very powerful didactic technique that I managed to improve even more on the last exercise. I will show you how this happened at the final part of the last exercise (11.11.21) on Semiconductor Devices with group 49a, ITI, FCST of Technical University of Sofia. I make full video recordings of ZOOM meetings with my students and, with their permission, I will use a link to the [latest record](https://photos.app.goo.gl/bGLcshsiVdYn4WhS6) (in Bulgarian). Here is also a snapshot of ZOOM whiteborad (really, the picture is not so beautiful... but attractive:-)
- 
- In another snapshot, I have drawn the Ohm's triangle on the resistive wire (the vertical leg is the voltage V, the horizontal leg is the resistance R, and the angle between the hypotenuse and the horizontal leg represents the current I):
- 
- It will be interesting for me to know your opinion about this didactic technique.
- Need to visualize voltage distribution
- --------------------------------------
- Once visualized the [voltages at the internal circuit points](https://electrical.codidact.com/posts/284860), we can go even further and "enter" inside resistors to visualize the voltages along the resistive film. This will allow us to see some interesting points (for example, virtual ground), the operation of well-known electrical devices (potentiometer, resistive summer) and electronic circuits (inverting, non-inverting, differential and instrumentation amplifiers).
- First ideas
- -----------
- This idea came to me in the early 90's. Then, for the purposes of intuitive understanding, I began representing local voltages inside resistors by a set of vertical segments whose length (height) was proportional to the local voltage magnitude (I named it voltage diagram). This notion of voltage came from a [hydraulic analogy](https://en.wikibooks.org/wiki/Circuit_Idea/Walking_along_the_Resistive_Film#Hydraulic_analogy:_Pressure_diagram) (a garden hose with evenly drilled holes) which I had seen in an old Electrical Engineering textbook. See, for example, an yellowed sheet of paper from my archive where, in 1990, I drew the voltage diagram of a resistor voltage summer:
- 
- It is more convenient to display only the shell of the diagram. Thus a triangle is obtained in which the vertical leg is the voltage V, the horizontal leg is the resistance R, and the angle between the hypotenuse and the horizontal leg represents the current I (another geometric representation of Ohm's law, see the Flash picture below).
- I have developed [various kinds of voltage diagrams](https://photos.app.goo.gl/aeQJAx4sqDEYDdtN8). I colored them in red (an association with pressure) to easily distinguish them from circuit diagrams drawn in black.
- Sophisticated voltage diagrams
- ------------------------------
- Later, I drew more sophisticated voltage pictures by means of Corel Draw. See, for example, the circuit of a _voltage divider_ with constant input voltage VREF (applied from the left)...
- 
- ... and of a voltage divider with varying (from the right) input voltage Vin2 (I made them in the late 90's):
- 
- "Live" voltage diagrams
- -----------------------
- In 2000, I made [Flash animated circuit tutorials](https://www.circuit-fantasia.com/collections/circuit-collection/circuits/old-circuits/v-to-i-old.html) with "live"voltage diagrams that were changing proportionally to the voltage magnitude (you need [Ruffle Flash emulator](https://www.blogger.com/blog/post/edit/6662876180507761501/8403863750906537047#) to see this movie because Adobe Flash player is no longer supported).
- 
- "Really live" voltage diagrams
- ----------------------------
- But then I had the desire to make "reallly live" voltage diagrams that use actually measured voltages at several base points in the circuit. For this purpose, I used MICROLAB data acquisition system (see the [Wikibooks story about Ohm's experiment](https://en.wikibooks.org/wiki/Circuit_Idea/Walking_along_the_Resistive_Film#How_to_visualize_the_voltage_diagram_on_the_screen) and the detailed 5 min [movie](https://photos.app.goo.gl/TDUKTRKeNPoc4mMC7)). In this attractive experiment, a linear potentiometer was supplied by two DACs and the voltages of its three terminals (E1 of the left end, E2 of the right end and E3 of the wiper) were measured by three ADC inputs. The other points of the voltage diagram were calculated. Also, conventional voltmeters were connected:
- 
- When E1 and E2 had opposite polarities, the famous _virtual ground_ appeared:
- 
- The content is more important than form
- ---------------------------------------
- But, as in the case of [current loops](https://electrical.codidact.com/posts/284816) and [voltage bars](https://electrical.codidact.com/posts/284860), I finally came to the conclusion that content was more important than form... and I began to draw circuit diagrams with superimposed voltage pictures by hand. For example, in the [Wikibooks story about Ohm's experiment](https://en.wikibooks.org/wiki/Circuit_Idea/Walking_along_the_Resistive_Film), I have drawn the voltage diagrams by color fiber pens on a white sheet of paper. Here is an example of a _voltage divider_ with constant input voltage V...
- 
- ... and of a _resistor summer_ with oppositely varying input voltages Vin1 and Vin2 (an illustration of an op-amp voltage inverter):
- 
- Voltage diagrams vs voltage bars
- --------------------------------
- What do voltage diagrams actually represent compared with voltage bars? The voltage diagram is a further development of the voltage bar representation. Voltage bars are a one-dimensional way of representing voltages while the voltage diagram is a two-dimensional way. The voltage diagram is a set of voltage bars.
- The voltage diagram is based on a linearly distributed resistance along the length of the resistor. In most cases this representation is artificial, because ordinary resistors in electronic circuits are discrete; but it allows to illustrate the circuit operation with voltage diagram. In many cases, quantitative parameters (transfer ratios, etc.) can be directly seen.
- What is the difference between a voltage diagram and voltage oscillogram at a given point in the diagram? The difference is significant, they have nothing in common. The voltage diagram shows voltage distribution along a resistance film, ie what local voltages inside a resistor are. The resistor is considered not as a "point" (without dimensions) but as a "line" (at each point of this line, in a certain step, a section perpendicular to the line is drawn, with a height proportional to the voltage at this point).
- An oscillogram is a set of points that represent voltages (by a vertical displacement) at successive points in time through. So, the particular segments of a voltage diagram represent the voltages at particular points of the resistive layer at the same time while the oscillogram shows the voltages at one point but at different points in time.
- Helping the online learning
- ---------------------------
- As I have said in the stories about [current loops](https://electrical.codidact.com/posts/284816) and [voltage bars](https://electrical.codidact.com/posts/284860), a year ago, when we switched to online learning, I started using the ZOOM pen to draw on existing web circuit diagrams. This turned out to be a very powerful didactic technique that I managed to improve even more on the last exercise. I will show you how this happened at the final part of the last exercise (11.11.21) on Semiconductor Devices with group 49a, ITI, FCST of Technical University of Sofia. I make full video recordings of ZOOM meetings with my students and, with their permission, I will use a link to the [latest record](https://photos.app.goo.gl/bGLcshsiVdYn4WhS6) (in Bulgarian). Here is also a snapshot of ZOOM whiteborad (really, the picture is not so beautiful... but attractive:-)
- 
- In another snapshot, I have drawn the Ohm's triangle on the resistive wire (the vertical leg is the voltage V, the horizontal leg is the resistance R, and the angle between the hypotenuse and the horizontal leg represents the current I):
- 
- It will be interesting for me to know your opinion about this didactic technique.
#10: Post edited
by
Circuit fantasist
·
2021-11-15T15:16:52Z (over 3 years ago)
Minor edit
- Need to visualize voltage distribution
- --------------------------------------
- Once visualized the [voltages at the internal circuit points](https://electrical.codidact.com/posts/284860), we can go even further and "enter" inside resistors to visualize the voltages along the resistive film. This will allow us to see some interesting points (for example, virtual ground), the operation of well-known electrical devices (potentiometer, resistive summer) and electronic circuits (inverting, non-inverting, differential and instrumentation amplifiers).
- First ideas
- -----------
- This idea came to me in the early 90's. Then, for the purposes of intuitive understanding, I began representing local voltages inside resistors by a set of vertical segments whose length (height) was proportional to the local voltage magnitude (I named it voltage diagram). This notion of voltage came from a [hydraulic analogy](https://en.wikibooks.org/wiki/Circuit_Idea/Walking_along_the_Resistive_Film#Hydraulic_analogy:_Pressure_diagram) (a garden hose with evenly drilled holes) which I had seen in an old Electrical Engineering textbook. See, for example, an yellowed sheet of paper from my archive where, in 1990, I drew the voltage diagram of a resistor voltage summer:
- 
- It is more convenient to display only the shell of the diagram. Thus a triangle is obtained in which the vertical leg is the voltage V, the horizontal leg is the resistance R, and the angle between the hypotenuse and the horizontal leg represents the current I (another geometric representation of Ohm's law, see the Flash picture below).
- I have developed [various kinds of voltage diagrams](https://photos.app.goo.gl/aeQJAx4sqDEYDdtN8). I colored them in red (an association with pressure) to easily distinguish them from circuit diagrams drawn in black.
- Sophisticated voltage diagrams
- ------------------------------
- Later, I drew more sophisticated voltage pictures by means of Corel Draw. See, for example, the circuit of a _voltage divider_ with constant input voltage VREF (applied from the left)...
- 
- ... and of a voltage divider with varying (from the right) input voltage Vin2 (I made them in the late 90's):
- 
- "Live" voltage diagrams
- -----------------------
- In 2000, I made [Flash animated circuit tutorials](https://www.circuit-fantasia.com/collections/circuit-collection/circuits/old-circuits/v-to-i-old.html) with "live"voltage diagrams that were changing proportionally to the voltage magnitude (you need [Ruffle Flash emulator](https://www.blogger.com/blog/post/edit/6662876180507761501/8403863750906537047#) to see this movie because Adobe Flash player is no longer supported).
- 
- "Reallly live" voltage diagrams
- ----------------------------
But then I had the desire to make "real live" voltage diagrams that use actually measured voltages at several base points in the circuit. For this purpose, I used MICROLAB data acquisition system (see the [Wikibooks story about Ohm's experiment](https://en.wikibooks.org/wiki/Circuit_Idea/Walking_along_the_Resistive_Film#How_to_visualize_the_voltage_diagram_on_the_screen) and the detailed 5 min [movie](https://photos.app.goo.gl/TDUKTRKeNPoc4mMC7)). In this attractive experiment, a linear potentiometer was supplied by two DACs and the voltages of its three terminals (E1 of the left end, E2 of the right end and E3 of the wiper) were measured by three ADC inputs. The other points of the voltage diagram were calculated. Also, conventional voltmeters were connected:- 
- When E1 and E2 had opposite polarities, the famous _virtual ground_ appeared:
- 
- The content is more important than form
- ---------------------------------------
- But, as in the case of [current loops](https://electrical.codidact.com/posts/284816) and [voltage bars](https://electrical.codidact.com/posts/284860), I finally came to the conclusion that content was more important than form... and I began to draw circuit diagrams with superimposed voltage pictures by hand. For example, in the [Wikibooks story about Ohm's experiment](https://en.wikibooks.org/wiki/Circuit_Idea/Walking_along_the_Resistive_Film), I have drawn the voltage diagrams by color fiber pens on a white sheet of paper. Here is an example of a _voltage divider_ with constant input voltage V...
- 
- ... and of a _resistor summer_ with oppositely varying input voltages Vin1 and Vin2 (an illustration of an op-amp voltage inverter):
- 
- Voltage diagrams vs voltage bars
- --------------------------------
- What do voltage diagrams actually represent compared with voltage bars? The voltage diagram is a further development of the voltage bar representation. Voltage bars are a one-dimensional way of representing voltages while the voltage diagram is a two-dimensional way. The voltage diagram is a set of voltage bars.
- The voltage diagram is based on a linearly distributed resistance along the length of the resistor. In most cases this representation is artificial, because ordinary resistors in electronic circuits are discrete; but it allows to illustrate the circuit operation with voltage diagram. In many cases, quantitative parameters (transfer ratios, etc.) can be directly seen.
- What is the difference between a voltage diagram and voltage oscillogram at a given point in the diagram? The difference is significant, they have nothing in common. The voltage diagram shows voltage distribution along a resistance film, ie what local voltages inside a resistor are. The resistor is considered not as a "point" (without dimensions) but as a "line" (at each point of this line, in a certain step, a section perpendicular to the line is drawn, with a height proportional to the voltage at this point).
- An oscillogram is a set of points that represent voltages (by a vertical displacement) at successive points in time through. So, the particular segments of a voltage diagram represent the voltages at particular points of the resistive layer at the same time while the oscillogram shows the voltages at one point but at different points in time.
- Helping the online learning
- ---------------------------
- As I have said in the stories about [current loops](https://electrical.codidact.com/posts/284816) and [voltage bars](https://electrical.codidact.com/posts/284860), a year ago, when we switched to online learning, I started using the ZOOM pen to draw on existing web circuit diagrams. This turned out to be a very powerful didactic technique that I managed to improve even more on the last exercise. I will show you how this happened at the final part of the last exercise (11.11.21) on Semiconductor Devices with group 49a, ITI, FCST of Technical University of Sofia. I make full video recordings of ZOOM meetings with my students and, with their permission, I will use a link to the [latest record](https://photos.app.goo.gl/bGLcshsiVdYn4WhS6) (in Bulgarian). Here is also a snapshot of ZOOM whiteborad (really, the picture is not so beautiful... but attractive:-)
- 
- In another snapshot, I have drawn the Ohm's triangle on the resistive wire (the vertical leg is the voltage V, the horizontal leg is the resistance R, and the angle between the hypotenuse and the horizontal leg represents the current I):
- 
- It will be interesting for me to know your opinion about this didactic technique.
- Need to visualize voltage distribution
- --------------------------------------
- Once visualized the [voltages at the internal circuit points](https://electrical.codidact.com/posts/284860), we can go even further and "enter" inside resistors to visualize the voltages along the resistive film. This will allow us to see some interesting points (for example, virtual ground), the operation of well-known electrical devices (potentiometer, resistive summer) and electronic circuits (inverting, non-inverting, differential and instrumentation amplifiers).
- First ideas
- -----------
- This idea came to me in the early 90's. Then, for the purposes of intuitive understanding, I began representing local voltages inside resistors by a set of vertical segments whose length (height) was proportional to the local voltage magnitude (I named it voltage diagram). This notion of voltage came from a [hydraulic analogy](https://en.wikibooks.org/wiki/Circuit_Idea/Walking_along_the_Resistive_Film#Hydraulic_analogy:_Pressure_diagram) (a garden hose with evenly drilled holes) which I had seen in an old Electrical Engineering textbook. See, for example, an yellowed sheet of paper from my archive where, in 1990, I drew the voltage diagram of a resistor voltage summer:
- 
- It is more convenient to display only the shell of the diagram. Thus a triangle is obtained in which the vertical leg is the voltage V, the horizontal leg is the resistance R, and the angle between the hypotenuse and the horizontal leg represents the current I (another geometric representation of Ohm's law, see the Flash picture below).
- I have developed [various kinds of voltage diagrams](https://photos.app.goo.gl/aeQJAx4sqDEYDdtN8). I colored them in red (an association with pressure) to easily distinguish them from circuit diagrams drawn in black.
- Sophisticated voltage diagrams
- ------------------------------
- Later, I drew more sophisticated voltage pictures by means of Corel Draw. See, for example, the circuit of a _voltage divider_ with constant input voltage VREF (applied from the left)...
- 
- ... and of a voltage divider with varying (from the right) input voltage Vin2 (I made them in the late 90's):
- 
- "Live" voltage diagrams
- -----------------------
- In 2000, I made [Flash animated circuit tutorials](https://www.circuit-fantasia.com/collections/circuit-collection/circuits/old-circuits/v-to-i-old.html) with "live"voltage diagrams that were changing proportionally to the voltage magnitude (you need [Ruffle Flash emulator](https://www.blogger.com/blog/post/edit/6662876180507761501/8403863750906537047#) to see this movie because Adobe Flash player is no longer supported).
- 
- "Reallly live" voltage diagrams
- ----------------------------
- But then I had the desire to make "reallly live" voltage diagrams that use actually measured voltages at several base points in the circuit. For this purpose, I used MICROLAB data acquisition system (see the [Wikibooks story about Ohm's experiment](https://en.wikibooks.org/wiki/Circuit_Idea/Walking_along_the_Resistive_Film#How_to_visualize_the_voltage_diagram_on_the_screen) and the detailed 5 min [movie](https://photos.app.goo.gl/TDUKTRKeNPoc4mMC7)). In this attractive experiment, a linear potentiometer was supplied by two DACs and the voltages of its three terminals (E1 of the left end, E2 of the right end and E3 of the wiper) were measured by three ADC inputs. The other points of the voltage diagram were calculated. Also, conventional voltmeters were connected:
- 
- When E1 and E2 had opposite polarities, the famous _virtual ground_ appeared:
- 
- The content is more important than form
- ---------------------------------------
- But, as in the case of [current loops](https://electrical.codidact.com/posts/284816) and [voltage bars](https://electrical.codidact.com/posts/284860), I finally came to the conclusion that content was more important than form... and I began to draw circuit diagrams with superimposed voltage pictures by hand. For example, in the [Wikibooks story about Ohm's experiment](https://en.wikibooks.org/wiki/Circuit_Idea/Walking_along_the_Resistive_Film), I have drawn the voltage diagrams by color fiber pens on a white sheet of paper. Here is an example of a _voltage divider_ with constant input voltage V...
- 
- ... and of a _resistor summer_ with oppositely varying input voltages Vin1 and Vin2 (an illustration of an op-amp voltage inverter):
- 
- Voltage diagrams vs voltage bars
- --------------------------------
- What do voltage diagrams actually represent compared with voltage bars? The voltage diagram is a further development of the voltage bar representation. Voltage bars are a one-dimensional way of representing voltages while the voltage diagram is a two-dimensional way. The voltage diagram is a set of voltage bars.
- The voltage diagram is based on a linearly distributed resistance along the length of the resistor. In most cases this representation is artificial, because ordinary resistors in electronic circuits are discrete; but it allows to illustrate the circuit operation with voltage diagram. In many cases, quantitative parameters (transfer ratios, etc.) can be directly seen.
- What is the difference between a voltage diagram and voltage oscillogram at a given point in the diagram? The difference is significant, they have nothing in common. The voltage diagram shows voltage distribution along a resistance film, ie what local voltages inside a resistor are. The resistor is considered not as a "point" (without dimensions) but as a "line" (at each point of this line, in a certain step, a section perpendicular to the line is drawn, with a height proportional to the voltage at this point).
- An oscillogram is a set of points that represent voltages (by a vertical displacement) at successive points in time through. So, the particular segments of a voltage diagram represent the voltages at particular points of the resistive layer at the same time while the oscillogram shows the voltages at one point but at different points in time.
- Helping the online learning
- ---------------------------
- As I have said in the stories about [current loops](https://electrical.codidact.com/posts/284816) and [voltage bars](https://electrical.codidact.com/posts/284860), a year ago, when we switched to online learning, I started using the ZOOM pen to draw on existing web circuit diagrams. This turned out to be a very powerful didactic technique that I managed to improve even more on the last exercise. I will show you how this happened at the final part of the last exercise (11.11.21) on Semiconductor Devices with group 49a, ITI, FCST of Technical University of Sofia. I make full video recordings of ZOOM meetings with my students and, with their permission, I will use a link to the [latest record](https://photos.app.goo.gl/bGLcshsiVdYn4WhS6) (in Bulgarian). Here is also a snapshot of ZOOM whiteborad (really, the picture is not so beautiful... but attractive:-)
- 
- In another snapshot, I have drawn the Ohm's triangle on the resistive wire (the vertical leg is the voltage V, the horizontal leg is the resistance R, and the angle between the hypotenuse and the horizontal leg represents the current I):
- 
- It will be interesting for me to know your opinion about this didactic technique.
#9: Post edited
by
Circuit fantasist
·
2021-11-15T15:15:55Z (over 3 years ago)
Added more examples
- Need to visualize voltage distribution
- --------------------------------------
- Once visualized the [voltages at the internal circuit points](https://electrical.codidact.com/posts/284860), we can go even further and "enter" inside resistors to visualize the voltages along the resistive film. This will allow us to see some interesting points (for example, virtual ground), the operation of well-known electrical devices (potentiometer, resistive summer) and electronic circuits (inverting, non-inverting, differential and instrumentation amplifiers).
- First ideas
- -----------
- This idea came to me in the early 90's. Then, for the purposes of intuitive understanding, I began representing local voltages inside resistors by a set of vertical segments whose length (height) was proportional to the local voltage magnitude (I named it voltage diagram). This notion of voltage came from a [hydraulic analogy](https://en.wikibooks.org/wiki/Circuit_Idea/Walking_along_the_Resistive_Film#Hydraulic_analogy:_Pressure_diagram) (a garden hose with evenly drilled holes) which I had seen in an old Electrical Engineering textbook. See, for example, an yellowed sheet of paper from my archive where, in 1990, I drew the voltage diagram of a resistor voltage summer:
- 
- It is more convenient to display only the shell of the diagram. Thus a triangle is obtained in which the vertical leg is the voltage V, the horizontal leg is the resistance R, and the angle between the hypotenuse and the horizontal leg represents the current I (another geometric representation of Ohm's law, see the Flash picture below).
- I have developed [various kinds of voltage diagrams](https://photos.app.goo.gl/aeQJAx4sqDEYDdtN8). I colored them in red (an association with pressure) to easily distinguish them from circuit diagrams drawn in black.
- Sophisticated voltage diagrams
- ------------------------------
Later, I drew more sophisticated voltage pictures by means of Corel Draw. See, for example, the circuit of a resistor summer where the input voltage varies (I made it in the late 90's):- 
- "Live" voltage diagrams
- -----------------------
- In 2000, I made [Flash animated circuit tutorials](https://www.circuit-fantasia.com/collections/circuit-collection/circuits/old-circuits/v-to-i-old.html) with "live"voltage diagrams that were changing proportionally to the voltage magnitude (you need [Ruffle Flash emulator](https://www.blogger.com/blog/post/edit/6662876180507761501/8403863750906537047#) to see this movie because Adobe Flash player is no longer supported).
- 
- "Reallly live" voltage diagrams
- ----------------------------
- But then I had the desire to make "real live" voltage diagrams that use actually measured voltages at several base points in the circuit. For this purpose, I used MICROLAB data acquisition system (see the [Wikibooks story about Ohm's experiment](https://en.wikibooks.org/wiki/Circuit_Idea/Walking_along_the_Resistive_Film#How_to_visualize_the_voltage_diagram_on_the_screen) and the detailed 5 min [movie](https://photos.app.goo.gl/TDUKTRKeNPoc4mMC7)). In this attractive experiment, a linear potentiometer was supplied by two DACs and the voltages of its three terminals (E1 of the left end, E2 of the right end and E3 of the wiper) were measured by three ADC inputs. The other points of the voltage diagram were calculated. Also, conventional voltmeters were connected:
- 
- When E1 and E2 had opposite polarities, the famous _virtual ground_ appeared:
- 
- The content is more important than form
- ---------------------------------------
But, as in the case of [current loops](https://electrical.codidact.com/posts/284816) and [voltage bars](https://electrical.codidact.com/posts/284860), I finally came to the conclusion that content was more important than form... and I began to draw circuit diagrams with superimposed voltage pictures by hand. For example, in the [Wikibooks story about Ohm's experiment](https://en.wikibooks.org/wiki/Circuit_Idea/Walking_along_the_Resistive_Film), I have drawn the voltage diagrams by color fiber pens on a white sheet of paper:- 
- Voltage diagrams vs voltage bars
- --------------------------------
- What do voltage diagrams actually represent compared with voltage bars? The voltage diagram is a further development of the voltage bar representation. Voltage bars are a one-dimensional way of representing voltages while the voltage diagram is a two-dimensional way. The voltage diagram is a set of voltage bars.
- The voltage diagram is based on a linearly distributed resistance along the length of the resistor. In most cases this representation is artificial, because ordinary resistors in electronic circuits are discrete; but it allows to illustrate the circuit operation with voltage diagram. In many cases, quantitative parameters (transfer ratios, etc.) can be directly seen.
- What is the difference between a voltage diagram and voltage oscillogram at a given point in the diagram? The difference is significant, they have nothing in common. The voltage diagram shows voltage distribution along a resistance film, ie what local voltages inside a resistor are. The resistor is considered not as a "point" (without dimensions) but as a "line" (at each point of this line, in a certain step, a section perpendicular to the line is drawn, with a height proportional to the voltage at this point).
- An oscillogram is a set of points that represent voltages (by a vertical displacement) at successive points in time through. So, the particular segments of a voltage diagram represent the voltages at particular points of the resistive layer at the same time while the oscillogram shows the voltages at one point but at different points in time.
- Helping the online learning
- ---------------------------
- As I have said in the stories about [current loops](https://electrical.codidact.com/posts/284816) and [voltage bars](https://electrical.codidact.com/posts/284860), a year ago, when we switched to online learning, I started using the ZOOM pen to draw on existing web circuit diagrams. This turned out to be a very powerful didactic technique that I managed to improve even more on the last exercise. I will show you how this happened at the final part of the last exercise (11.11.21) on Semiconductor Devices with group 49a, ITI, FCST of Technical University of Sofia. I make full video recordings of ZOOM meetings with my students and, with their permission, I will use a link to the [latest record](https://photos.app.goo.gl/bGLcshsiVdYn4WhS6) (in Bulgarian). Here is also a snapshot of ZOOM whiteborad (really, the picture is not so beautiful... but attractive:-)
- 
- In another snapshot, I have drawn the Ohm's triangle on the resistive wire (the vertical leg is the voltage V, the horizontal leg is the resistance R, and the angle between the hypotenuse and the horizontal leg represents the current I):
- 
- It will be interesting for me to know your opinion about this didactic technique.
- Need to visualize voltage distribution
- --------------------------------------
- Once visualized the [voltages at the internal circuit points](https://electrical.codidact.com/posts/284860), we can go even further and "enter" inside resistors to visualize the voltages along the resistive film. This will allow us to see some interesting points (for example, virtual ground), the operation of well-known electrical devices (potentiometer, resistive summer) and electronic circuits (inverting, non-inverting, differential and instrumentation amplifiers).
- First ideas
- -----------
- This idea came to me in the early 90's. Then, for the purposes of intuitive understanding, I began representing local voltages inside resistors by a set of vertical segments whose length (height) was proportional to the local voltage magnitude (I named it voltage diagram). This notion of voltage came from a [hydraulic analogy](https://en.wikibooks.org/wiki/Circuit_Idea/Walking_along_the_Resistive_Film#Hydraulic_analogy:_Pressure_diagram) (a garden hose with evenly drilled holes) which I had seen in an old Electrical Engineering textbook. See, for example, an yellowed sheet of paper from my archive where, in 1990, I drew the voltage diagram of a resistor voltage summer:
- 
- It is more convenient to display only the shell of the diagram. Thus a triangle is obtained in which the vertical leg is the voltage V, the horizontal leg is the resistance R, and the angle between the hypotenuse and the horizontal leg represents the current I (another geometric representation of Ohm's law, see the Flash picture below).
- I have developed [various kinds of voltage diagrams](https://photos.app.goo.gl/aeQJAx4sqDEYDdtN8). I colored them in red (an association with pressure) to easily distinguish them from circuit diagrams drawn in black.
- Sophisticated voltage diagrams
- ------------------------------
- Later, I drew more sophisticated voltage pictures by means of Corel Draw. See, for example, the circuit of a _voltage divider_ with constant input voltage VREF (applied from the left)...
- 
- ... and of a voltage divider with varying (from the right) input voltage Vin2 (I made them in the late 90's):
- 
- "Live" voltage diagrams
- -----------------------
- In 2000, I made [Flash animated circuit tutorials](https://www.circuit-fantasia.com/collections/circuit-collection/circuits/old-circuits/v-to-i-old.html) with "live"voltage diagrams that were changing proportionally to the voltage magnitude (you need [Ruffle Flash emulator](https://www.blogger.com/blog/post/edit/6662876180507761501/8403863750906537047#) to see this movie because Adobe Flash player is no longer supported).
- 
- "Reallly live" voltage diagrams
- ----------------------------
- But then I had the desire to make "real live" voltage diagrams that use actually measured voltages at several base points in the circuit. For this purpose, I used MICROLAB data acquisition system (see the [Wikibooks story about Ohm's experiment](https://en.wikibooks.org/wiki/Circuit_Idea/Walking_along_the_Resistive_Film#How_to_visualize_the_voltage_diagram_on_the_screen) and the detailed 5 min [movie](https://photos.app.goo.gl/TDUKTRKeNPoc4mMC7)). In this attractive experiment, a linear potentiometer was supplied by two DACs and the voltages of its three terminals (E1 of the left end, E2 of the right end and E3 of the wiper) were measured by three ADC inputs. The other points of the voltage diagram were calculated. Also, conventional voltmeters were connected:
- 
- When E1 and E2 had opposite polarities, the famous _virtual ground_ appeared:
- 
- The content is more important than form
- ---------------------------------------
- But, as in the case of [current loops](https://electrical.codidact.com/posts/284816) and [voltage bars](https://electrical.codidact.com/posts/284860), I finally came to the conclusion that content was more important than form... and I began to draw circuit diagrams with superimposed voltage pictures by hand. For example, in the [Wikibooks story about Ohm's experiment](https://en.wikibooks.org/wiki/Circuit_Idea/Walking_along_the_Resistive_Film), I have drawn the voltage diagrams by color fiber pens on a white sheet of paper. Here is an example of a _voltage divider_ with constant input voltage V...
- 
- ... and of a _resistor summer_ with oppositely varying input voltages Vin1 and Vin2 (an illustration of an op-amp voltage inverter):
- 
- Voltage diagrams vs voltage bars
- --------------------------------
- What do voltage diagrams actually represent compared with voltage bars? The voltage diagram is a further development of the voltage bar representation. Voltage bars are a one-dimensional way of representing voltages while the voltage diagram is a two-dimensional way. The voltage diagram is a set of voltage bars.
- The voltage diagram is based on a linearly distributed resistance along the length of the resistor. In most cases this representation is artificial, because ordinary resistors in electronic circuits are discrete; but it allows to illustrate the circuit operation with voltage diagram. In many cases, quantitative parameters (transfer ratios, etc.) can be directly seen.
- What is the difference between a voltage diagram and voltage oscillogram at a given point in the diagram? The difference is significant, they have nothing in common. The voltage diagram shows voltage distribution along a resistance film, ie what local voltages inside a resistor are. The resistor is considered not as a "point" (without dimensions) but as a "line" (at each point of this line, in a certain step, a section perpendicular to the line is drawn, with a height proportional to the voltage at this point).
- An oscillogram is a set of points that represent voltages (by a vertical displacement) at successive points in time through. So, the particular segments of a voltage diagram represent the voltages at particular points of the resistive layer at the same time while the oscillogram shows the voltages at one point but at different points in time.
- Helping the online learning
- ---------------------------
- As I have said in the stories about [current loops](https://electrical.codidact.com/posts/284816) and [voltage bars](https://electrical.codidact.com/posts/284860), a year ago, when we switched to online learning, I started using the ZOOM pen to draw on existing web circuit diagrams. This turned out to be a very powerful didactic technique that I managed to improve even more on the last exercise. I will show you how this happened at the final part of the last exercise (11.11.21) on Semiconductor Devices with group 49a, ITI, FCST of Technical University of Sofia. I make full video recordings of ZOOM meetings with my students and, with their permission, I will use a link to the [latest record](https://photos.app.goo.gl/bGLcshsiVdYn4WhS6) (in Bulgarian). Here is also a snapshot of ZOOM whiteborad (really, the picture is not so beautiful... but attractive:-)
- 
- In another snapshot, I have drawn the Ohm's triangle on the resistive wire (the vertical leg is the voltage V, the horizontal leg is the resistance R, and the angle between the hypotenuse and the horizontal leg represents the current I):
- 
- It will be interesting for me to know your opinion about this didactic technique.
#8: Post edited
by
Circuit fantasist
·
2021-11-14T16:35:07Z (over 3 years ago)
Minor edit
- Need to visualize voltage distribution
- --------------------------------------
- Once visualized the [voltages at the internal circuit points](https://electrical.codidact.com/posts/284860), we can go even further and "enter" inside resistors to visualize the voltages along the resistive film. This will allow us to see some interesting points (for example, virtual ground), the operation of well-known electrical devices (potentiometer, resistive summer) and electronic circuits (inverting, non-inverting, differential and instrumentation amplifiers).
- First ideas
- -----------
- This idea came to me in the early 90's. Then, for the purposes of intuitive understanding, I began representing local voltages inside resistors by a set of vertical segments whose length (height) was proportional to the local voltage magnitude (I named it voltage diagram). This notion of voltage came from a [hydraulic analogy](https://en.wikibooks.org/wiki/Circuit_Idea/Walking_along_the_Resistive_Film#Hydraulic_analogy:_Pressure_diagram) (a garden hose with evenly drilled holes) which I had seen in an old Electrical Engineering textbook. See, for example, an yellowed sheet of paper from my archive where, in 1990, I drew the voltage diagram of a resistor voltage summer:
- 
- It is more convenient to display only the shell of the diagram. Thus a triangle is obtained in which the vertical leg is the voltage V, the horizontal leg is the resistance R, and the angle between the hypotenuse and the horizontal leg represents the current I (another geometric representation of Ohm's law, see the Flash picture below).
- I have developed [various kinds of voltage diagrams](https://photos.app.goo.gl/aeQJAx4sqDEYDdtN8). I colored them in red (an association with pressure) to easily distinguish them from circuit diagrams drawn in black.
- Sophisticated voltage diagrams
- ------------------------------
- Later, I drew more sophisticated voltage pictures by means of Corel Draw. See, for example, the circuit of a resistor summer where the input voltage varies (I made it in the late 90's):
- 
- "Live" voltage diagrams
- -----------------------
- In 2000, I made [Flash animated circuit tutorials](https://www.circuit-fantasia.com/collections/circuit-collection/circuits/old-circuits/v-to-i-old.html) with "live"voltage diagrams that were changing proportionally to the voltage magnitude (you need [Ruffle Flash emulator](https://www.blogger.com/blog/post/edit/6662876180507761501/8403863750906537047#) to see this movie because Adobe Flash player is no longer supported).
- 
- "Reallly live" voltage diagrams
- ----------------------------
- But then I had the desire to make "real live" voltage diagrams that use actually measured voltages at several base points in the circuit. For this purpose, I used MICROLAB data acquisition system (see the [Wikibooks story about Ohm's experiment](https://en.wikibooks.org/wiki/Circuit_Idea/Walking_along_the_Resistive_Film#How_to_visualize_the_voltage_diagram_on_the_screen) and the detailed 5 min [movie](https://photos.app.goo.gl/TDUKTRKeNPoc4mMC7)). In this attractive experiment, a linear potentiometer was supplied by two DACs and the voltages of its three terminals (E1 of the left end, E2 of the right end and E3 of the wiper) were measured by three ADC inputs. The other points of the voltage diagram were calculated. Also, conventional voltmeters were connected:
- 
When E1 and E2 had opposite polarities, the famois _virtual ground_ appeared:- 
- The content is more important than form
- ---------------------------------------
- But, as in the case of [current loops](https://electrical.codidact.com/posts/284816) and [voltage bars](https://electrical.codidact.com/posts/284860), I finally came to the conclusion that content was more important than form... and I began to draw circuit diagrams with superimposed voltage pictures by hand. For example, in the [Wikibooks story about Ohm's experiment](https://en.wikibooks.org/wiki/Circuit_Idea/Walking_along_the_Resistive_Film), I have drawn the voltage diagrams by color fiber pens on a white sheet of paper:
- 
- Voltage diagrams vs voltage bars
- --------------------------------
- What do voltage diagrams actually represent compared with voltage bars? The voltage diagram is a further development of the voltage bar representation. Voltage bars are a one-dimensional way of representing voltages while the voltage diagram is a two-dimensional way. The voltage diagram is a set of voltage bars.
- The voltage diagram is based on a linearly distributed resistance along the length of the resistor. In most cases this representation is artificial, because ordinary resistors in electronic circuits are discrete; but it allows to illustrate the circuit operation with voltage diagram. In many cases, quantitative parameters (transfer ratios, etc.) can be directly seen.
- What is the difference between a voltage diagram and voltage oscillogram at a given point in the diagram? The difference is significant, they have nothing in common. The voltage diagram shows voltage distribution along a resistance film, ie what local voltages inside a resistor are. The resistor is considered not as a "point" (without dimensions) but as a "line" (at each point of this line, in a certain step, a section perpendicular to the line is drawn, with a height proportional to the voltage at this point).
- An oscillogram is a set of points that represent voltages (by a vertical displacement) at successive points in time through. So, the particular segments of a voltage diagram represent the voltages at particular points of the resistive layer at the same time while the oscillogram shows the voltages at one point but at different points in time.
- Helping the online learning
- ---------------------------
- As I have said in the stories about [current loops](https://electrical.codidact.com/posts/284816) and [voltage bars](https://electrical.codidact.com/posts/284860), a year ago, when we switched to online learning, I started using the ZOOM pen to draw on existing web circuit diagrams. This turned out to be a very powerful didactic technique that I managed to improve even more on the last exercise. I will show you how this happened at the final part of the last exercise (11.11.21) on Semiconductor Devices with group 49a, ITI, FCST of Technical University of Sofia. I make full video recordings of ZOOM meetings with my students and, with their permission, I will use a link to the [latest record](https://photos.app.goo.gl/bGLcshsiVdYn4WhS6) (in Bulgarian). Here is also a snapshot of ZOOM whiteborad (really, the picture is not so beautiful... but attractive:-)
- 
- In another snapshot, I have drawn the Ohm's triangle on the resistive wire (the vertical leg is the voltage V, the horizontal leg is the resistance R, and the angle between the hypotenuse and the horizontal leg represents the current I):
- 
- It will be interesting for me to know your opinion about this didactic technique.
- Need to visualize voltage distribution
- --------------------------------------
- Once visualized the [voltages at the internal circuit points](https://electrical.codidact.com/posts/284860), we can go even further and "enter" inside resistors to visualize the voltages along the resistive film. This will allow us to see some interesting points (for example, virtual ground), the operation of well-known electrical devices (potentiometer, resistive summer) and electronic circuits (inverting, non-inverting, differential and instrumentation amplifiers).
- First ideas
- -----------
- This idea came to me in the early 90's. Then, for the purposes of intuitive understanding, I began representing local voltages inside resistors by a set of vertical segments whose length (height) was proportional to the local voltage magnitude (I named it voltage diagram). This notion of voltage came from a [hydraulic analogy](https://en.wikibooks.org/wiki/Circuit_Idea/Walking_along_the_Resistive_Film#Hydraulic_analogy:_Pressure_diagram) (a garden hose with evenly drilled holes) which I had seen in an old Electrical Engineering textbook. See, for example, an yellowed sheet of paper from my archive where, in 1990, I drew the voltage diagram of a resistor voltage summer:
- 
- It is more convenient to display only the shell of the diagram. Thus a triangle is obtained in which the vertical leg is the voltage V, the horizontal leg is the resistance R, and the angle between the hypotenuse and the horizontal leg represents the current I (another geometric representation of Ohm's law, see the Flash picture below).
- I have developed [various kinds of voltage diagrams](https://photos.app.goo.gl/aeQJAx4sqDEYDdtN8). I colored them in red (an association with pressure) to easily distinguish them from circuit diagrams drawn in black.
- Sophisticated voltage diagrams
- ------------------------------
- Later, I drew more sophisticated voltage pictures by means of Corel Draw. See, for example, the circuit of a resistor summer where the input voltage varies (I made it in the late 90's):
- 
- "Live" voltage diagrams
- -----------------------
- In 2000, I made [Flash animated circuit tutorials](https://www.circuit-fantasia.com/collections/circuit-collection/circuits/old-circuits/v-to-i-old.html) with "live"voltage diagrams that were changing proportionally to the voltage magnitude (you need [Ruffle Flash emulator](https://www.blogger.com/blog/post/edit/6662876180507761501/8403863750906537047#) to see this movie because Adobe Flash player is no longer supported).
- 
- "Reallly live" voltage diagrams
- ----------------------------
- But then I had the desire to make "real live" voltage diagrams that use actually measured voltages at several base points in the circuit. For this purpose, I used MICROLAB data acquisition system (see the [Wikibooks story about Ohm's experiment](https://en.wikibooks.org/wiki/Circuit_Idea/Walking_along_the_Resistive_Film#How_to_visualize_the_voltage_diagram_on_the_screen) and the detailed 5 min [movie](https://photos.app.goo.gl/TDUKTRKeNPoc4mMC7)). In this attractive experiment, a linear potentiometer was supplied by two DACs and the voltages of its three terminals (E1 of the left end, E2 of the right end and E3 of the wiper) were measured by three ADC inputs. The other points of the voltage diagram were calculated. Also, conventional voltmeters were connected:
- 
- When E1 and E2 had opposite polarities, the famous _virtual ground_ appeared:
- 
- The content is more important than form
- ---------------------------------------
- But, as in the case of [current loops](https://electrical.codidact.com/posts/284816) and [voltage bars](https://electrical.codidact.com/posts/284860), I finally came to the conclusion that content was more important than form... and I began to draw circuit diagrams with superimposed voltage pictures by hand. For example, in the [Wikibooks story about Ohm's experiment](https://en.wikibooks.org/wiki/Circuit_Idea/Walking_along_the_Resistive_Film), I have drawn the voltage diagrams by color fiber pens on a white sheet of paper:
- 
- Voltage diagrams vs voltage bars
- --------------------------------
- What do voltage diagrams actually represent compared with voltage bars? The voltage diagram is a further development of the voltage bar representation. Voltage bars are a one-dimensional way of representing voltages while the voltage diagram is a two-dimensional way. The voltage diagram is a set of voltage bars.
- The voltage diagram is based on a linearly distributed resistance along the length of the resistor. In most cases this representation is artificial, because ordinary resistors in electronic circuits are discrete; but it allows to illustrate the circuit operation with voltage diagram. In many cases, quantitative parameters (transfer ratios, etc.) can be directly seen.
- What is the difference between a voltage diagram and voltage oscillogram at a given point in the diagram? The difference is significant, they have nothing in common. The voltage diagram shows voltage distribution along a resistance film, ie what local voltages inside a resistor are. The resistor is considered not as a "point" (without dimensions) but as a "line" (at each point of this line, in a certain step, a section perpendicular to the line is drawn, with a height proportional to the voltage at this point).
- An oscillogram is a set of points that represent voltages (by a vertical displacement) at successive points in time through. So, the particular segments of a voltage diagram represent the voltages at particular points of the resistive layer at the same time while the oscillogram shows the voltages at one point but at different points in time.
- Helping the online learning
- ---------------------------
- As I have said in the stories about [current loops](https://electrical.codidact.com/posts/284816) and [voltage bars](https://electrical.codidact.com/posts/284860), a year ago, when we switched to online learning, I started using the ZOOM pen to draw on existing web circuit diagrams. This turned out to be a very powerful didactic technique that I managed to improve even more on the last exercise. I will show you how this happened at the final part of the last exercise (11.11.21) on Semiconductor Devices with group 49a, ITI, FCST of Technical University of Sofia. I make full video recordings of ZOOM meetings with my students and, with their permission, I will use a link to the [latest record](https://photos.app.goo.gl/bGLcshsiVdYn4WhS6) (in Bulgarian). Here is also a snapshot of ZOOM whiteborad (really, the picture is not so beautiful... but attractive:-)
- 
- In another snapshot, I have drawn the Ohm's triangle on the resistive wire (the vertical leg is the voltage V, the horizontal leg is the resistance R, and the angle between the hypotenuse and the horizontal leg represents the current I):
- 
- It will be interesting for me to know your opinion about this didactic technique.
#7: Post edited
by
Circuit fantasist
·
2021-11-14T15:30:41Z (over 3 years ago)
Minor edit
- Need to visualize voltage distribution
- --------------------------------------
- Once visualized the [voltages at the internal circuit points](https://electrical.codidact.com/posts/284860), we can go even further and "enter" inside resistors to visualize the voltages along the resistive film. This will allow us to see some interesting points (for example, virtual ground), the operation of well-known electrical devices (potentiometer, resistive summer) and electronic circuits (inverting, non-inverting, differential and instrumentation amplifiers).
- First ideas
- -----------
- This idea came to me in the early 90's. Then, for the purposes of intuitive understanding, I began representing local voltages inside resistors by a set of vertical segments whose length (height) was proportional to the local voltage magnitude (I named it voltage diagram). This notion of voltage came from a [hydraulic analogy](https://en.wikibooks.org/wiki/Circuit_Idea/Walking_along_the_Resistive_Film#Hydraulic_analogy:_Pressure_diagram) (a garden hose with evenly drilled holes) which I had seen in an old Electrical Engineering textbook. See, for example, an yellowed sheet of paper from my archive where, in 1990, I drew the voltage diagram of a resistor voltage summer:
- 
- It is more convenient to display only the shell of the diagram. Thus a triangle is obtained in which the vertical leg is the voltage V, the horizontal leg is the resistance R, and the angle between the hypotenuse and the horizontal leg represents the current I (another geometric representation of Ohm's law, see the Flash picture below).
- I have developed [various kinds of voltage diagrams](https://photos.app.goo.gl/aeQJAx4sqDEYDdtN8). I colored them in red (an association with pressure) to easily distinguish them from circuit diagrams drawn in black.
- Sophisticated voltage diagrams
- ------------------------------
- Later, I drew more sophisticated voltage pictures by means of Corel Draw. See, for example, the circuit of a resistor summer where the input voltage varies (I made it in the late 90's):
- 
- "Live" voltage diagrams
- -----------------------
- In 2000, I made [Flash animated circuit tutorials](https://www.circuit-fantasia.com/collections/circuit-collection/circuits/old-circuits/v-to-i-old.html) with "live"voltage diagrams that were changing proportionally to the voltage magnitude (you need [Ruffle Flash emulator](https://www.blogger.com/blog/post/edit/6662876180507761501/8403863750906537047#) to see this movie because Adobe Flash player is no longer supported).
- 
- "Reallly live" voltage diagrams
- ----------------------------
- But then I had the desire to make "real live" voltage diagrams that use actually measured voltages at several base points in the circuit. For this purpose, I used MICROLAB data acquisition system (see the [Wikibooks story about Ohm's experiment](https://en.wikibooks.org/wiki/Circuit_Idea/Walking_along_the_Resistive_Film#How_to_visualize_the_voltage_diagram_on_the_screen) and the detailed 5 min [movie](https://photos.app.goo.gl/TDUKTRKeNPoc4mMC7)). In this attractive experiment, a linear potentiometer was supplied by two DACs and the voltages of its three terminals (E1 of the left end, E2 of the right end and E3 of the wiper) were measured by three ADC inputs. The other points of the voltage diagram were calculated. Also, conventional voltmeters were connected:
- 
When E1 and E2 had opposite polarities, the famois virtual ground appeared:- 
- The content is more important than form
- ---------------------------------------
- But, as in the case of [current loops](https://electrical.codidact.com/posts/284816) and [voltage bars](https://electrical.codidact.com/posts/284860), I finally came to the conclusion that content was more important than form... and I began to draw circuit diagrams with superimposed voltage pictures by hand. For example, in the [Wikibooks story about Ohm's experiment](https://en.wikibooks.org/wiki/Circuit_Idea/Walking_along_the_Resistive_Film), I have drawn the voltage diagrams by color fiber pens on a white sheet of paper:
- 
- Voltage diagrams vs voltage bars
- --------------------------------
- What do voltage diagrams actually represent compared with voltage bars? The voltage diagram is a further development of the voltage bar representation. Voltage bars are a one-dimensional way of representing voltages while the voltage diagram is a two-dimensional way. The voltage diagram is a set of voltage bars.
- The voltage diagram is based on a linearly distributed resistance along the length of the resistor. In most cases this representation is artificial, because ordinary resistors in electronic circuits are discrete; but it allows to illustrate the circuit operation with voltage diagram. In many cases, quantitative parameters (transfer ratios, etc.) can be directly seen.
- What is the difference between a voltage diagram and voltage oscillogram at a given point in the diagram? The difference is significant, they have nothing in common. The voltage diagram shows voltage distribution along a resistance film, ie what local voltages inside a resistor are. The resistor is considered not as a "point" (without dimensions) but as a "line" (at each point of this line, in a certain step, a section perpendicular to the line is drawn, with a height proportional to the voltage at this point).
- An oscillogram is a set of points that represent voltages (by a vertical displacement) at successive points in time through. So, the particular segments of a voltage diagram represent the voltages at particular points of the resistive layer at the same time while the oscillogram shows the voltages at one point but at different points in time.
- Helping the online learning
- ---------------------------
- As I have said in the stories about [current loops](https://electrical.codidact.com/posts/284816) and [voltage bars](https://electrical.codidact.com/posts/284860), a year ago, when we switched to online learning, I started using the ZOOM pen to draw on existing web circuit diagrams. This turned out to be a very powerful didactic technique that I managed to improve even more on the last exercise. I will show you how this happened at the final part of the last exercise (11.11.21) on Semiconductor Devices with group 49a, ITI, FCST of Technical University of Sofia. I make full video recordings of ZOOM meetings with my students and, with their permission, I will use a link to the [latest record](https://photos.app.goo.gl/bGLcshsiVdYn4WhS6) (in Bulgarian). Here is also a snapshot of ZOOM whiteborad (really, the picture is not so beautiful... but attractive:-)
- 
- In another snapshot, I have drawn the Ohm's triangle on the resistive wire (the vertical leg is the voltage V, the horizontal leg is the resistance R, and the angle between the hypotenuse and the horizontal leg represents the current I):
- 
- It will be interesting for me to know your opinion about this didactic technique.
- Need to visualize voltage distribution
- --------------------------------------
- Once visualized the [voltages at the internal circuit points](https://electrical.codidact.com/posts/284860), we can go even further and "enter" inside resistors to visualize the voltages along the resistive film. This will allow us to see some interesting points (for example, virtual ground), the operation of well-known electrical devices (potentiometer, resistive summer) and electronic circuits (inverting, non-inverting, differential and instrumentation amplifiers).
- First ideas
- -----------
- This idea came to me in the early 90's. Then, for the purposes of intuitive understanding, I began representing local voltages inside resistors by a set of vertical segments whose length (height) was proportional to the local voltage magnitude (I named it voltage diagram). This notion of voltage came from a [hydraulic analogy](https://en.wikibooks.org/wiki/Circuit_Idea/Walking_along_the_Resistive_Film#Hydraulic_analogy:_Pressure_diagram) (a garden hose with evenly drilled holes) which I had seen in an old Electrical Engineering textbook. See, for example, an yellowed sheet of paper from my archive where, in 1990, I drew the voltage diagram of a resistor voltage summer:
- 
- It is more convenient to display only the shell of the diagram. Thus a triangle is obtained in which the vertical leg is the voltage V, the horizontal leg is the resistance R, and the angle between the hypotenuse and the horizontal leg represents the current I (another geometric representation of Ohm's law, see the Flash picture below).
- I have developed [various kinds of voltage diagrams](https://photos.app.goo.gl/aeQJAx4sqDEYDdtN8). I colored them in red (an association with pressure) to easily distinguish them from circuit diagrams drawn in black.
- Sophisticated voltage diagrams
- ------------------------------
- Later, I drew more sophisticated voltage pictures by means of Corel Draw. See, for example, the circuit of a resistor summer where the input voltage varies (I made it in the late 90's):
- 
- "Live" voltage diagrams
- -----------------------
- In 2000, I made [Flash animated circuit tutorials](https://www.circuit-fantasia.com/collections/circuit-collection/circuits/old-circuits/v-to-i-old.html) with "live"voltage diagrams that were changing proportionally to the voltage magnitude (you need [Ruffle Flash emulator](https://www.blogger.com/blog/post/edit/6662876180507761501/8403863750906537047#) to see this movie because Adobe Flash player is no longer supported).
- 
- "Reallly live" voltage diagrams
- ----------------------------
- But then I had the desire to make "real live" voltage diagrams that use actually measured voltages at several base points in the circuit. For this purpose, I used MICROLAB data acquisition system (see the [Wikibooks story about Ohm's experiment](https://en.wikibooks.org/wiki/Circuit_Idea/Walking_along_the_Resistive_Film#How_to_visualize_the_voltage_diagram_on_the_screen) and the detailed 5 min [movie](https://photos.app.goo.gl/TDUKTRKeNPoc4mMC7)). In this attractive experiment, a linear potentiometer was supplied by two DACs and the voltages of its three terminals (E1 of the left end, E2 of the right end and E3 of the wiper) were measured by three ADC inputs. The other points of the voltage diagram were calculated. Also, conventional voltmeters were connected:
- 
- When E1 and E2 had opposite polarities, the famois _virtual ground_ appeared:
- 
- The content is more important than form
- ---------------------------------------
- But, as in the case of [current loops](https://electrical.codidact.com/posts/284816) and [voltage bars](https://electrical.codidact.com/posts/284860), I finally came to the conclusion that content was more important than form... and I began to draw circuit diagrams with superimposed voltage pictures by hand. For example, in the [Wikibooks story about Ohm's experiment](https://en.wikibooks.org/wiki/Circuit_Idea/Walking_along_the_Resistive_Film), I have drawn the voltage diagrams by color fiber pens on a white sheet of paper:
- 
- Voltage diagrams vs voltage bars
- --------------------------------
- What do voltage diagrams actually represent compared with voltage bars? The voltage diagram is a further development of the voltage bar representation. Voltage bars are a one-dimensional way of representing voltages while the voltage diagram is a two-dimensional way. The voltage diagram is a set of voltage bars.
- The voltage diagram is based on a linearly distributed resistance along the length of the resistor. In most cases this representation is artificial, because ordinary resistors in electronic circuits are discrete; but it allows to illustrate the circuit operation with voltage diagram. In many cases, quantitative parameters (transfer ratios, etc.) can be directly seen.
- What is the difference between a voltage diagram and voltage oscillogram at a given point in the diagram? The difference is significant, they have nothing in common. The voltage diagram shows voltage distribution along a resistance film, ie what local voltages inside a resistor are. The resistor is considered not as a "point" (without dimensions) but as a "line" (at each point of this line, in a certain step, a section perpendicular to the line is drawn, with a height proportional to the voltage at this point).
- An oscillogram is a set of points that represent voltages (by a vertical displacement) at successive points in time through. So, the particular segments of a voltage diagram represent the voltages at particular points of the resistive layer at the same time while the oscillogram shows the voltages at one point but at different points in time.
- Helping the online learning
- ---------------------------
- As I have said in the stories about [current loops](https://electrical.codidact.com/posts/284816) and [voltage bars](https://electrical.codidact.com/posts/284860), a year ago, when we switched to online learning, I started using the ZOOM pen to draw on existing web circuit diagrams. This turned out to be a very powerful didactic technique that I managed to improve even more on the last exercise. I will show you how this happened at the final part of the last exercise (11.11.21) on Semiconductor Devices with group 49a, ITI, FCST of Technical University of Sofia. I make full video recordings of ZOOM meetings with my students and, with their permission, I will use a link to the [latest record](https://photos.app.goo.gl/bGLcshsiVdYn4WhS6) (in Bulgarian). Here is also a snapshot of ZOOM whiteborad (really, the picture is not so beautiful... but attractive:-)
- 
- In another snapshot, I have drawn the Ohm's triangle on the resistive wire (the vertical leg is the voltage V, the horizontal leg is the resistance R, and the angle between the hypotenuse and the horizontal leg represents the current I):
- 
- It will be interesting for me to know your opinion about this didactic technique.
#6: Post edited
by
Circuit fantasist
·
2021-11-14T15:29:55Z (over 3 years ago)
Added another picture and explanation
- Need to visualize voltage distribution
- --------------------------------------
- Once visualized the [voltages at the internal circuit points](https://electrical.codidact.com/posts/284860), we can go even further and "enter" inside resistors to visualize the voltages along the resistive film. This will allow us to see some interesting points (for example, virtual ground), the operation of well-known electrical devices (potentiometer, resistive summer) and electronic circuits (inverting, non-inverting, differential and instrumentation amplifiers).
- First ideas
- -----------
- This idea came to me in the early 90's. Then, for the purposes of intuitive understanding, I began representing local voltages inside resistors by a set of vertical segments whose length (height) was proportional to the local voltage magnitude (I named it voltage diagram). This notion of voltage came from a [hydraulic analogy](https://en.wikibooks.org/wiki/Circuit_Idea/Walking_along_the_Resistive_Film#Hydraulic_analogy:_Pressure_diagram) (a garden hose with evenly drilled holes) which I had seen in an old Electrical Engineering textbook. See, for example, an yellowed sheet of paper from my archive where, in 1990, I drew the voltage diagram of a resistor voltage summer:
- 
- It is more convenient to display only the shell of the diagram. Thus a triangle is obtained in which the vertical leg is the voltage V, the horizontal leg is the resistance R, and the angle between the hypotenuse and the horizontal leg represents the current I (another geometric representation of Ohm's law, see the Flash picture below).
- I have developed [various kinds of voltage diagrams](https://photos.app.goo.gl/aeQJAx4sqDEYDdtN8). I colored them in red (an association with pressure) to easily distinguish them from circuit diagrams drawn in black.
- Sophisticated voltage diagrams
- ------------------------------
- Later, I drew more sophisticated voltage pictures by means of Corel Draw. See, for example, the circuit of a resistor summer where the input voltage varies (I made it in the late 90's):
- 
- "Live" voltage diagrams
- -----------------------
- In 2000, I made [Flash animated circuit tutorials](https://www.circuit-fantasia.com/collections/circuit-collection/circuits/old-circuits/v-to-i-old.html) with "live"voltage diagrams that were changing proportionally to the voltage magnitude (you need [Ruffle Flash emulator](https://www.blogger.com/blog/post/edit/6662876180507761501/8403863750906537047#) to see this movie because Adobe Flash player is no longer supported).
- 
- "Reallly live" voltage diagrams
- ----------------------------
But then I had the desire to make "real live" voltage diagrams that use actually measured voltages at several base points in the circuit. For this purpose, I used MICROLAB data acquisition system (see the [Wikibooks story about Ohm's experiment](https://en.wikibooks.org/wiki/Circuit_Idea/Walking_along_the_Resistive_Film#How_to_visualize_the_voltage_diagram_on_the_screen) and the detailed 5 min [movie](https://photos.app.goo.gl/TDUKTRKeNPoc4mMC7)):- 
In this attractive experiment, a linear potentiometer was supplied by two DACs and the voltages of its three terminals (E1 of the left end, E2 of the right end and E3 of the wiper) were measured by three ADC inputs. The other points of the voltage diagram were calculated. Also, conventional voltmeters were connected.- The content is more important than form
- ---------------------------------------
- But, as in the case of [current loops](https://electrical.codidact.com/posts/284816) and [voltage bars](https://electrical.codidact.com/posts/284860), I finally came to the conclusion that content was more important than form... and I began to draw circuit diagrams with superimposed voltage pictures by hand. For example, in the [Wikibooks story about Ohm's experiment](https://en.wikibooks.org/wiki/Circuit_Idea/Walking_along_the_Resistive_Film), I have drawn the voltage diagrams by color fiber pens on a white sheet of paper:
- 
- Voltage diagrams vs voltage bars
- --------------------------------
- What do voltage diagrams actually represent compared with voltage bars? The voltage diagram is a further development of the voltage bar representation. Voltage bars are a one-dimensional way of representing voltages while the voltage diagram is a two-dimensional way. The voltage diagram is a set of voltage bars.
- The voltage diagram is based on a linearly distributed resistance along the length of the resistor. In most cases this representation is artificial, because ordinary resistors in electronic circuits are discrete; but it allows to illustrate the circuit operation with voltage diagram. In many cases, quantitative parameters (transfer ratios, etc.) can be directly seen.
- What is the difference between a voltage diagram and voltage oscillogram at a given point in the diagram? The difference is significant, they have nothing in common. The voltage diagram shows voltage distribution along a resistance film, ie what local voltages inside a resistor are. The resistor is considered not as a "point" (without dimensions) but as a "line" (at each point of this line, in a certain step, a section perpendicular to the line is drawn, with a height proportional to the voltage at this point).
- An oscillogram is a set of points that represent voltages (by a vertical displacement) at successive points in time through. So, the particular segments of a voltage diagram represent the voltages at particular points of the resistive layer at the same time while the oscillogram shows the voltages at one point but at different points in time.
- Helping the online learning
- ---------------------------
- As I have said in the stories about [current loops](https://electrical.codidact.com/posts/284816) and [voltage bars](https://electrical.codidact.com/posts/284860), a year ago, when we switched to online learning, I started using the ZOOM pen to draw on existing web circuit diagrams. This turned out to be a very powerful didactic technique that I managed to improve even more on the last exercise. I will show you how this happened at the final part of the last exercise (11.11.21) on Semiconductor Devices with group 49a, ITI, FCST of Technical University of Sofia. I make full video recordings of ZOOM meetings with my students and, with their permission, I will use a link to the [latest record](https://photos.app.goo.gl/bGLcshsiVdYn4WhS6) (in Bulgarian). Here is also a snapshot of ZOOM whiteborad (really, the picture is not so beautiful... but attractive:-)
- 
- In another snapshot, I have drawn the Ohm's triangle on the resistive wire (the vertical leg is the voltage V, the horizontal leg is the resistance R, and the angle between the hypotenuse and the horizontal leg represents the current I):
- 
- It will be interesting for me to know your opinion about this didactic technique.
- Need to visualize voltage distribution
- --------------------------------------
- Once visualized the [voltages at the internal circuit points](https://electrical.codidact.com/posts/284860), we can go even further and "enter" inside resistors to visualize the voltages along the resistive film. This will allow us to see some interesting points (for example, virtual ground), the operation of well-known electrical devices (potentiometer, resistive summer) and electronic circuits (inverting, non-inverting, differential and instrumentation amplifiers).
- First ideas
- -----------
- This idea came to me in the early 90's. Then, for the purposes of intuitive understanding, I began representing local voltages inside resistors by a set of vertical segments whose length (height) was proportional to the local voltage magnitude (I named it voltage diagram). This notion of voltage came from a [hydraulic analogy](https://en.wikibooks.org/wiki/Circuit_Idea/Walking_along_the_Resistive_Film#Hydraulic_analogy:_Pressure_diagram) (a garden hose with evenly drilled holes) which I had seen in an old Electrical Engineering textbook. See, for example, an yellowed sheet of paper from my archive where, in 1990, I drew the voltage diagram of a resistor voltage summer:
- 
- It is more convenient to display only the shell of the diagram. Thus a triangle is obtained in which the vertical leg is the voltage V, the horizontal leg is the resistance R, and the angle between the hypotenuse and the horizontal leg represents the current I (another geometric representation of Ohm's law, see the Flash picture below).
- I have developed [various kinds of voltage diagrams](https://photos.app.goo.gl/aeQJAx4sqDEYDdtN8). I colored them in red (an association with pressure) to easily distinguish them from circuit diagrams drawn in black.
- Sophisticated voltage diagrams
- ------------------------------
- Later, I drew more sophisticated voltage pictures by means of Corel Draw. See, for example, the circuit of a resistor summer where the input voltage varies (I made it in the late 90's):
- 
- "Live" voltage diagrams
- -----------------------
- In 2000, I made [Flash animated circuit tutorials](https://www.circuit-fantasia.com/collections/circuit-collection/circuits/old-circuits/v-to-i-old.html) with "live"voltage diagrams that were changing proportionally to the voltage magnitude (you need [Ruffle Flash emulator](https://www.blogger.com/blog/post/edit/6662876180507761501/8403863750906537047#) to see this movie because Adobe Flash player is no longer supported).
- 
- "Reallly live" voltage diagrams
- ----------------------------
- But then I had the desire to make "real live" voltage diagrams that use actually measured voltages at several base points in the circuit. For this purpose, I used MICROLAB data acquisition system (see the [Wikibooks story about Ohm's experiment](https://en.wikibooks.org/wiki/Circuit_Idea/Walking_along_the_Resistive_Film#How_to_visualize_the_voltage_diagram_on_the_screen) and the detailed 5 min [movie](https://photos.app.goo.gl/TDUKTRKeNPoc4mMC7)). In this attractive experiment, a linear potentiometer was supplied by two DACs and the voltages of its three terminals (E1 of the left end, E2 of the right end and E3 of the wiper) were measured by three ADC inputs. The other points of the voltage diagram were calculated. Also, conventional voltmeters were connected:
- 
- When E1 and E2 had opposite polarities, the famois virtual ground appeared:
- 
- The content is more important than form
- ---------------------------------------
- But, as in the case of [current loops](https://electrical.codidact.com/posts/284816) and [voltage bars](https://electrical.codidact.com/posts/284860), I finally came to the conclusion that content was more important than form... and I began to draw circuit diagrams with superimposed voltage pictures by hand. For example, in the [Wikibooks story about Ohm's experiment](https://en.wikibooks.org/wiki/Circuit_Idea/Walking_along_the_Resistive_Film), I have drawn the voltage diagrams by color fiber pens on a white sheet of paper:
- 
- Voltage diagrams vs voltage bars
- --------------------------------
- What do voltage diagrams actually represent compared with voltage bars? The voltage diagram is a further development of the voltage bar representation. Voltage bars are a one-dimensional way of representing voltages while the voltage diagram is a two-dimensional way. The voltage diagram is a set of voltage bars.
- The voltage diagram is based on a linearly distributed resistance along the length of the resistor. In most cases this representation is artificial, because ordinary resistors in electronic circuits are discrete; but it allows to illustrate the circuit operation with voltage diagram. In many cases, quantitative parameters (transfer ratios, etc.) can be directly seen.
- What is the difference between a voltage diagram and voltage oscillogram at a given point in the diagram? The difference is significant, they have nothing in common. The voltage diagram shows voltage distribution along a resistance film, ie what local voltages inside a resistor are. The resistor is considered not as a "point" (without dimensions) but as a "line" (at each point of this line, in a certain step, a section perpendicular to the line is drawn, with a height proportional to the voltage at this point).
- An oscillogram is a set of points that represent voltages (by a vertical displacement) at successive points in time through. So, the particular segments of a voltage diagram represent the voltages at particular points of the resistive layer at the same time while the oscillogram shows the voltages at one point but at different points in time.
- Helping the online learning
- ---------------------------
- As I have said in the stories about [current loops](https://electrical.codidact.com/posts/284816) and [voltage bars](https://electrical.codidact.com/posts/284860), a year ago, when we switched to online learning, I started using the ZOOM pen to draw on existing web circuit diagrams. This turned out to be a very powerful didactic technique that I managed to improve even more on the last exercise. I will show you how this happened at the final part of the last exercise (11.11.21) on Semiconductor Devices with group 49a, ITI, FCST of Technical University of Sofia. I make full video recordings of ZOOM meetings with my students and, with their permission, I will use a link to the [latest record](https://photos.app.goo.gl/bGLcshsiVdYn4WhS6) (in Bulgarian). Here is also a snapshot of ZOOM whiteborad (really, the picture is not so beautiful... but attractive:-)
- 
- In another snapshot, I have drawn the Ohm's triangle on the resistive wire (the vertical leg is the voltage V, the horizontal leg is the resistance R, and the angle between the hypotenuse and the horizontal leg represents the current I):
- 
- It will be interesting for me to know your opinion about this didactic technique.
#5: Post edited
by
Circuit fantasist
·
2021-11-13T21:41:15Z (over 3 years ago)
Minor edit
- Need to visualize voltage distribution
- --------------------------------------
- Once visualized the [voltages at the internal circuit points](https://electrical.codidact.com/posts/284860), we can go even further and "enter" inside resistors to visualize the voltages along the resistive film. This will allow us to see some interesting points (for example, virtual ground), the operation of well-known electrical devices (potentiometer, resistive summer) and electronic circuits (inverting, non-inverting, differential and instrumentation amplifiers).
- First ideas
- -----------
- This idea came to me in the early 90's. Then, for the purposes of intuitive understanding, I began representing local voltages inside resistors by a set of vertical segments whose length (height) was proportional to the local voltage magnitude (I named it voltage diagram). This notion of voltage came from a [hydraulic analogy](https://en.wikibooks.org/wiki/Circuit_Idea/Walking_along_the_Resistive_Film#Hydraulic_analogy:_Pressure_diagram) (a garden hose with evenly drilled holes) which I had seen in an old Electrical Engineering textbook. See, for example, an yellowed sheet of paper from my archive where, in 1990, I drew the voltage diagram of a resistor voltage summer:
- 
- It is more convenient to display only the shell of the diagram. Thus a triangle is obtained in which the vertical leg is the voltage V, the horizontal leg is the resistance R, and the angle between the hypotenuse and the horizontal leg represents the current I (another geometric representation of Ohm's law, see the Flash picture below).
- I have developed [various kinds of voltage diagrams](https://photos.app.goo.gl/aeQJAx4sqDEYDdtN8). I colored them in red (an association with pressure) to easily distinguish them from circuit diagrams drawn in black.
- Sophisticated voltage diagrams
- ------------------------------
- Later, I drew more sophisticated voltage pictures by means of Corel Draw. See, for example, the circuit of a resistor summer where the input voltage varies (I made it in the late 90's):
- 
- "Live" voltage diagrams
- -----------------------
- In 2000, I made [Flash animated circuit tutorials](https://www.circuit-fantasia.com/collections/circuit-collection/circuits/old-circuits/v-to-i-old.html) with "live"voltage diagrams that were changing proportionally to the voltage magnitude (you need [Ruffle Flash emulator](https://www.blogger.com/blog/post/edit/6662876180507761501/8403863750906537047#) to see this movie because Adobe Flash player is no longer supported).
- 
- "Reallly live" voltage diagrams
- ----------------------------
- But then I had the desire to make "real live" voltage diagrams that use actually measured voltages at several base points in the circuit. For this purpose, I used MICROLAB data acquisition system (see the [Wikibooks story about Ohm's experiment](https://en.wikibooks.org/wiki/Circuit_Idea/Walking_along_the_Resistive_Film#How_to_visualize_the_voltage_diagram_on_the_screen) and the detailed 5 min [movie](https://photos.app.goo.gl/TDUKTRKeNPoc4mMC7)):
- 
- In this attractive experiment, a linear potentiometer was supplied by two DACs and the voltages of its three terminals (E1 of the left end, E2 of the right end and E3 of the wiper) were measured by three ADC inputs. The other points of the voltage diagram were calculated. Also, conventional voltmeters were connected.
- The content is more important than form
- ---------------------------------------
- But, as in the case of [current loops](https://electrical.codidact.com/posts/284816) and [voltage bars](https://electrical.codidact.com/posts/284860), I finally came to the conclusion that content was more important than form... and I began to draw circuit diagrams with superimposed voltage pictures by hand. For example, in the [Wikibooks story about Ohm's experiment](https://en.wikibooks.org/wiki/Circuit_Idea/Walking_along_the_Resistive_Film), I have drawn the voltage diagrams by color fiber pens on a white sheet of paper:
- 
- Voltage diagrams vs voltage bars
- --------------------------------
- What do voltage diagrams actually represent compared with voltage bars? The voltage diagram is a further development of the voltage bar representation. Voltage bars are a one-dimensional way of representing voltages while the voltage diagram is a two-dimensional way. The voltage diagram is a set of voltage bars.
- The voltage diagram is based on a linearly distributed resistance along the length of the resistor. In most cases this representation is artificial, because ordinary resistors in electronic circuits are discrete; but it allows to illustrate the circuit operation with voltage diagram. In many cases, quantitative parameters (transfer ratios, etc.) can be directly seen.
- What is the difference between a voltage diagram and voltage oscillogram at a given point in the diagram? The difference is significant, they have nothing in common. The voltage diagram shows voltage distribution along a resistance film, ie what local voltages inside a resistor are. The resistor is considered not as a "point" (without dimensions) but as a "line" (at each point of this line, in a certain step, a section perpendicular to the line is drawn, with a height proportional to the voltage at this point).
An oscillogram is a set of points that represent voltages (by a vertical displacement) at successive points in time through. So, the particular segments of a voltage diagram represents the voltages at particular points of the resistive layer at the same time while the oscillogram shows the voltages at one point but at different points in time.- Helping the online learning
- ---------------------------
- As I have said in the stories about [current loops](https://electrical.codidact.com/posts/284816) and [voltage bars](https://electrical.codidact.com/posts/284860), a year ago, when we switched to online learning, I started using the ZOOM pen to draw on existing web circuit diagrams. This turned out to be a very powerful didactic technique that I managed to improve even more on the last exercise. I will show you how this happened at the final part of the last exercise (11.11.21) on Semiconductor Devices with group 49a, ITI, FCST of Technical University of Sofia. I make full video recordings of ZOOM meetings with my students and, with their permission, I will use a link to the [latest record](https://photos.app.goo.gl/bGLcshsiVdYn4WhS6) (in Bulgarian). Here is also a snapshot of ZOOM whiteborad (really, the picture is not so beautiful... but attractive:-)
- 
- In another snapshot, I have drawn the Ohm's triangle on the resistive wire (the vertical leg is the voltage V, the horizontal leg is the resistance R, and the angle between the hypotenuse and the horizontal leg represents the current I):
- 
- It will be interesting for me to know your opinion about this didactic technique.
- Need to visualize voltage distribution
- --------------------------------------
- Once visualized the [voltages at the internal circuit points](https://electrical.codidact.com/posts/284860), we can go even further and "enter" inside resistors to visualize the voltages along the resistive film. This will allow us to see some interesting points (for example, virtual ground), the operation of well-known electrical devices (potentiometer, resistive summer) and electronic circuits (inverting, non-inverting, differential and instrumentation amplifiers).
- First ideas
- -----------
- This idea came to me in the early 90's. Then, for the purposes of intuitive understanding, I began representing local voltages inside resistors by a set of vertical segments whose length (height) was proportional to the local voltage magnitude (I named it voltage diagram). This notion of voltage came from a [hydraulic analogy](https://en.wikibooks.org/wiki/Circuit_Idea/Walking_along_the_Resistive_Film#Hydraulic_analogy:_Pressure_diagram) (a garden hose with evenly drilled holes) which I had seen in an old Electrical Engineering textbook. See, for example, an yellowed sheet of paper from my archive where, in 1990, I drew the voltage diagram of a resistor voltage summer:
- 
- It is more convenient to display only the shell of the diagram. Thus a triangle is obtained in which the vertical leg is the voltage V, the horizontal leg is the resistance R, and the angle between the hypotenuse and the horizontal leg represents the current I (another geometric representation of Ohm's law, see the Flash picture below).
- I have developed [various kinds of voltage diagrams](https://photos.app.goo.gl/aeQJAx4sqDEYDdtN8). I colored them in red (an association with pressure) to easily distinguish them from circuit diagrams drawn in black.
- Sophisticated voltage diagrams
- ------------------------------
- Later, I drew more sophisticated voltage pictures by means of Corel Draw. See, for example, the circuit of a resistor summer where the input voltage varies (I made it in the late 90's):
- 
- "Live" voltage diagrams
- -----------------------
- In 2000, I made [Flash animated circuit tutorials](https://www.circuit-fantasia.com/collections/circuit-collection/circuits/old-circuits/v-to-i-old.html) with "live"voltage diagrams that were changing proportionally to the voltage magnitude (you need [Ruffle Flash emulator](https://www.blogger.com/blog/post/edit/6662876180507761501/8403863750906537047#) to see this movie because Adobe Flash player is no longer supported).
- 
- "Reallly live" voltage diagrams
- ----------------------------
- But then I had the desire to make "real live" voltage diagrams that use actually measured voltages at several base points in the circuit. For this purpose, I used MICROLAB data acquisition system (see the [Wikibooks story about Ohm's experiment](https://en.wikibooks.org/wiki/Circuit_Idea/Walking_along_the_Resistive_Film#How_to_visualize_the_voltage_diagram_on_the_screen) and the detailed 5 min [movie](https://photos.app.goo.gl/TDUKTRKeNPoc4mMC7)):
- 
- In this attractive experiment, a linear potentiometer was supplied by two DACs and the voltages of its three terminals (E1 of the left end, E2 of the right end and E3 of the wiper) were measured by three ADC inputs. The other points of the voltage diagram were calculated. Also, conventional voltmeters were connected.
- The content is more important than form
- ---------------------------------------
- But, as in the case of [current loops](https://electrical.codidact.com/posts/284816) and [voltage bars](https://electrical.codidact.com/posts/284860), I finally came to the conclusion that content was more important than form... and I began to draw circuit diagrams with superimposed voltage pictures by hand. For example, in the [Wikibooks story about Ohm's experiment](https://en.wikibooks.org/wiki/Circuit_Idea/Walking_along_the_Resistive_Film), I have drawn the voltage diagrams by color fiber pens on a white sheet of paper:
- 
- Voltage diagrams vs voltage bars
- --------------------------------
- What do voltage diagrams actually represent compared with voltage bars? The voltage diagram is a further development of the voltage bar representation. Voltage bars are a one-dimensional way of representing voltages while the voltage diagram is a two-dimensional way. The voltage diagram is a set of voltage bars.
- The voltage diagram is based on a linearly distributed resistance along the length of the resistor. In most cases this representation is artificial, because ordinary resistors in electronic circuits are discrete; but it allows to illustrate the circuit operation with voltage diagram. In many cases, quantitative parameters (transfer ratios, etc.) can be directly seen.
- What is the difference between a voltage diagram and voltage oscillogram at a given point in the diagram? The difference is significant, they have nothing in common. The voltage diagram shows voltage distribution along a resistance film, ie what local voltages inside a resistor are. The resistor is considered not as a "point" (without dimensions) but as a "line" (at each point of this line, in a certain step, a section perpendicular to the line is drawn, with a height proportional to the voltage at this point).
- An oscillogram is a set of points that represent voltages (by a vertical displacement) at successive points in time through. So, the particular segments of a voltage diagram represent the voltages at particular points of the resistive layer at the same time while the oscillogram shows the voltages at one point but at different points in time.
- Helping the online learning
- ---------------------------
- As I have said in the stories about [current loops](https://electrical.codidact.com/posts/284816) and [voltage bars](https://electrical.codidact.com/posts/284860), a year ago, when we switched to online learning, I started using the ZOOM pen to draw on existing web circuit diagrams. This turned out to be a very powerful didactic technique that I managed to improve even more on the last exercise. I will show you how this happened at the final part of the last exercise (11.11.21) on Semiconductor Devices with group 49a, ITI, FCST of Technical University of Sofia. I make full video recordings of ZOOM meetings with my students and, with their permission, I will use a link to the [latest record](https://photos.app.goo.gl/bGLcshsiVdYn4WhS6) (in Bulgarian). Here is also a snapshot of ZOOM whiteborad (really, the picture is not so beautiful... but attractive:-)
- 
- In another snapshot, I have drawn the Ohm's triangle on the resistive wire (the vertical leg is the voltage V, the horizontal leg is the resistance R, and the angle between the hypotenuse and the horizontal leg represents the current I):
- 
- It will be interesting for me to know your opinion about this didactic technique.
#4: Post edited
by
Circuit fantasist
·
2021-11-13T19:13:21Z (over 3 years ago)
Saying it more precise
- Need to visualize voltage distribution
- --------------------------------------
Once visualized the [voltages at the internal circuit points](https://electrical.codidact.com/posts/284860), we can go even further and "enter" inside resistors to visualize the voltages across the resistive film. This will allow us to see some interesting points (for example, virtual ground), the operation of well-known electrical devices (potentiometer, resistive summer) and electronic circuits (inverting, non-inverting, differential and instrumentation amplifiers).- First ideas
- -----------
- This idea came to me in the early 90's. Then, for the purposes of intuitive understanding, I began representing local voltages inside resistors by a set of vertical segments whose length (height) was proportional to the local voltage magnitude (I named it voltage diagram). This notion of voltage came from a [hydraulic analogy](https://en.wikibooks.org/wiki/Circuit_Idea/Walking_along_the_Resistive_Film#Hydraulic_analogy:_Pressure_diagram) (a garden hose with evenly drilled holes) which I had seen in an old Electrical Engineering textbook. See, for example, an yellowed sheet of paper from my archive where, in 1990, I drew the voltage diagram of a resistor voltage summer:
- 
- It is more convenient to display only the shell of the diagram. Thus a triangle is obtained in which the vertical leg is the voltage V, the horizontal leg is the resistance R, and the angle between the hypotenuse and the horizontal leg represents the current I (another geometric representation of Ohm's law, see the Flash picture below).
- I have developed [various kinds of voltage diagrams](https://photos.app.goo.gl/aeQJAx4sqDEYDdtN8). I colored them in red (an association with pressure) to easily distinguish them from circuit diagrams drawn in black.
- Sophisticated voltage diagrams
- ------------------------------
- Later, I drew more sophisticated voltage pictures by means of Corel Draw. See, for example, the circuit of a resistor summer where the input voltage varies (I made it in the late 90's):
- 
- "Live" voltage diagrams
- -----------------------
- In 2000, I made [Flash animated circuit tutorials](https://www.circuit-fantasia.com/collections/circuit-collection/circuits/old-circuits/v-to-i-old.html) with "live"voltage diagrams that were changing proportionally to the voltage magnitude (you need [Ruffle Flash emulator](https://www.blogger.com/blog/post/edit/6662876180507761501/8403863750906537047#) to see this movie because Adobe Flash player is no longer supported).
- 
- "Reallly live" voltage diagrams
- ----------------------------
- But then I had the desire to make "real live" voltage diagrams that use actually measured voltages at several base points in the circuit. For this purpose, I used MICROLAB data acquisition system (see the [Wikibooks story about Ohm's experiment](https://en.wikibooks.org/wiki/Circuit_Idea/Walking_along_the_Resistive_Film#How_to_visualize_the_voltage_diagram_on_the_screen) and the detailed 5 min [movie](https://photos.app.goo.gl/TDUKTRKeNPoc4mMC7)):
- 
- In this attractive experiment, a linear potentiometer was supplied by two DACs and the voltages of its three terminals (E1 of the left end, E2 of the right end and E3 of the wiper) were measured by three ADC inputs. The other points of the voltage diagram were calculated. Also, conventional voltmeters were connected.
- The content is more important than form
- ---------------------------------------
- But, as in the case of [current loops](https://electrical.codidact.com/posts/284816) and [voltage bars](https://electrical.codidact.com/posts/284860), I finally came to the conclusion that content was more important than form... and I began to draw circuit diagrams with superimposed voltage pictures by hand. For example, in the [Wikibooks story about Ohm's experiment](https://en.wikibooks.org/wiki/Circuit_Idea/Walking_along_the_Resistive_Film), I have drawn the voltage diagrams by color fiber pens on a white sheet of paper:
- 
- Voltage diagrams vs voltage bars
- --------------------------------
- What do voltage diagrams actually represent compared with voltage bars? The voltage diagram is a further development of the voltage bar representation. Voltage bars are a one-dimensional way of representing voltages while the voltage diagram is a two-dimensional way. The voltage diagram is a set of voltage bars.
- The voltage diagram is based on a linearly distributed resistance along the length of the resistor. In most cases this representation is artificial, because ordinary resistors in electronic circuits are discrete; but it allows to illustrate the circuit operation with voltage diagram. In many cases, quantitative parameters (transfer ratios, etc.) can be directly seen.
- What is the difference between a voltage diagram and voltage oscillogram at a given point in the diagram? The difference is significant, they have nothing in common. The voltage diagram shows voltage distribution along a resistance film, ie what local voltages inside a resistor are. The resistor is considered not as a "point" (without dimensions) but as a "line" (at each point of this line, in a certain step, a section perpendicular to the line is drawn, with a height proportional to the voltage at this point).
- An oscillogram is a set of points that represent voltages (by a vertical displacement) at successive points in time through. So, the particular segments of a voltage diagram represents the voltages at particular points of the resistive layer at the same time while the oscillogram shows the voltages at one point but at different points in time.
- Helping the online learning
- ---------------------------
- As I have said in the stories about [current loops](https://electrical.codidact.com/posts/284816) and [voltage bars](https://electrical.codidact.com/posts/284860), a year ago, when we switched to online learning, I started using the ZOOM pen to draw on existing web circuit diagrams. This turned out to be a very powerful didactic technique that I managed to improve even more on the last exercise. I will show you how this happened at the final part of the last exercise (11.11.21) on Semiconductor Devices with group 49a, ITI, FCST of Technical University of Sofia. I make full video recordings of ZOOM meetings with my students and, with their permission, I will use a link to the [latest record](https://photos.app.goo.gl/bGLcshsiVdYn4WhS6) (in Bulgarian). Here is also a snapshot of ZOOM whiteborad (really, the picture is not so beautiful... but attractive:-)
- 
- In another snapshot, I have drawn the Ohm's triangle on the resistive wire (the vertical leg is the voltage V, the horizontal leg is the resistance R, and the angle between the hypotenuse and the horizontal leg represents the current I):
- 
- It will be interesting for me to know your opinion about this didactic technique.
- Need to visualize voltage distribution
- --------------------------------------
- Once visualized the [voltages at the internal circuit points](https://electrical.codidact.com/posts/284860), we can go even further and "enter" inside resistors to visualize the voltages along the resistive film. This will allow us to see some interesting points (for example, virtual ground), the operation of well-known electrical devices (potentiometer, resistive summer) and electronic circuits (inverting, non-inverting, differential and instrumentation amplifiers).
- First ideas
- -----------
- This idea came to me in the early 90's. Then, for the purposes of intuitive understanding, I began representing local voltages inside resistors by a set of vertical segments whose length (height) was proportional to the local voltage magnitude (I named it voltage diagram). This notion of voltage came from a [hydraulic analogy](https://en.wikibooks.org/wiki/Circuit_Idea/Walking_along_the_Resistive_Film#Hydraulic_analogy:_Pressure_diagram) (a garden hose with evenly drilled holes) which I had seen in an old Electrical Engineering textbook. See, for example, an yellowed sheet of paper from my archive where, in 1990, I drew the voltage diagram of a resistor voltage summer:
- 
- It is more convenient to display only the shell of the diagram. Thus a triangle is obtained in which the vertical leg is the voltage V, the horizontal leg is the resistance R, and the angle between the hypotenuse and the horizontal leg represents the current I (another geometric representation of Ohm's law, see the Flash picture below).
- I have developed [various kinds of voltage diagrams](https://photos.app.goo.gl/aeQJAx4sqDEYDdtN8). I colored them in red (an association with pressure) to easily distinguish them from circuit diagrams drawn in black.
- Sophisticated voltage diagrams
- ------------------------------
- Later, I drew more sophisticated voltage pictures by means of Corel Draw. See, for example, the circuit of a resistor summer where the input voltage varies (I made it in the late 90's):
- 
- "Live" voltage diagrams
- -----------------------
- In 2000, I made [Flash animated circuit tutorials](https://www.circuit-fantasia.com/collections/circuit-collection/circuits/old-circuits/v-to-i-old.html) with "live"voltage diagrams that were changing proportionally to the voltage magnitude (you need [Ruffle Flash emulator](https://www.blogger.com/blog/post/edit/6662876180507761501/8403863750906537047#) to see this movie because Adobe Flash player is no longer supported).
- 
- "Reallly live" voltage diagrams
- ----------------------------
- But then I had the desire to make "real live" voltage diagrams that use actually measured voltages at several base points in the circuit. For this purpose, I used MICROLAB data acquisition system (see the [Wikibooks story about Ohm's experiment](https://en.wikibooks.org/wiki/Circuit_Idea/Walking_along_the_Resistive_Film#How_to_visualize_the_voltage_diagram_on_the_screen) and the detailed 5 min [movie](https://photos.app.goo.gl/TDUKTRKeNPoc4mMC7)):
- 
- In this attractive experiment, a linear potentiometer was supplied by two DACs and the voltages of its three terminals (E1 of the left end, E2 of the right end and E3 of the wiper) were measured by three ADC inputs. The other points of the voltage diagram were calculated. Also, conventional voltmeters were connected.
- The content is more important than form
- ---------------------------------------
- But, as in the case of [current loops](https://electrical.codidact.com/posts/284816) and [voltage bars](https://electrical.codidact.com/posts/284860), I finally came to the conclusion that content was more important than form... and I began to draw circuit diagrams with superimposed voltage pictures by hand. For example, in the [Wikibooks story about Ohm's experiment](https://en.wikibooks.org/wiki/Circuit_Idea/Walking_along_the_Resistive_Film), I have drawn the voltage diagrams by color fiber pens on a white sheet of paper:
- 
- Voltage diagrams vs voltage bars
- --------------------------------
- What do voltage diagrams actually represent compared with voltage bars? The voltage diagram is a further development of the voltage bar representation. Voltage bars are a one-dimensional way of representing voltages while the voltage diagram is a two-dimensional way. The voltage diagram is a set of voltage bars.
- The voltage diagram is based on a linearly distributed resistance along the length of the resistor. In most cases this representation is artificial, because ordinary resistors in electronic circuits are discrete; but it allows to illustrate the circuit operation with voltage diagram. In many cases, quantitative parameters (transfer ratios, etc.) can be directly seen.
- What is the difference between a voltage diagram and voltage oscillogram at a given point in the diagram? The difference is significant, they have nothing in common. The voltage diagram shows voltage distribution along a resistance film, ie what local voltages inside a resistor are. The resistor is considered not as a "point" (without dimensions) but as a "line" (at each point of this line, in a certain step, a section perpendicular to the line is drawn, with a height proportional to the voltage at this point).
- An oscillogram is a set of points that represent voltages (by a vertical displacement) at successive points in time through. So, the particular segments of a voltage diagram represents the voltages at particular points of the resistive layer at the same time while the oscillogram shows the voltages at one point but at different points in time.
- Helping the online learning
- ---------------------------
- As I have said in the stories about [current loops](https://electrical.codidact.com/posts/284816) and [voltage bars](https://electrical.codidact.com/posts/284860), a year ago, when we switched to online learning, I started using the ZOOM pen to draw on existing web circuit diagrams. This turned out to be a very powerful didactic technique that I managed to improve even more on the last exercise. I will show you how this happened at the final part of the last exercise (11.11.21) on Semiconductor Devices with group 49a, ITI, FCST of Technical University of Sofia. I make full video recordings of ZOOM meetings with my students and, with their permission, I will use a link to the [latest record](https://photos.app.goo.gl/bGLcshsiVdYn4WhS6) (in Bulgarian). Here is also a snapshot of ZOOM whiteborad (really, the picture is not so beautiful... but attractive:-)
- 
- In another snapshot, I have drawn the Ohm's triangle on the resistive wire (the vertical leg is the voltage V, the horizontal leg is the resistance R, and the angle between the hypotenuse and the horizontal leg represents the current I):
- 
- It will be interesting for me to know your opinion about this didactic technique.
#3: Post edited
by
Circuit fantasist
·
2021-11-13T19:10:22Z (over 3 years ago)
Added clarification
- Need to visualize voltage distribution
- --------------------------------------
- Once visualized the [voltages at the internal circuit points](https://electrical.codidact.com/posts/284860), we can go even further and "enter" inside resistors to visualize the voltages across the resistive film. This will allow us to see some interesting points (for example, virtual ground), the operation of well-known electrical devices (potentiometer, resistive summer) and electronic circuits (inverting, non-inverting, differential and instrumentation amplifiers).
- First ideas
- -----------
- This idea came to me in the early 90's. Then, for the purposes of intuitive understanding, I began representing local voltages inside resistors by a set of vertical segments whose length (height) was proportional to the local voltage magnitude (I named it voltage diagram). This notion of voltage came from a [hydraulic analogy](https://en.wikibooks.org/wiki/Circuit_Idea/Walking_along_the_Resistive_Film#Hydraulic_analogy:_Pressure_diagram) (a garden hose with evenly drilled holes) which I had seen in an old Electrical Engineering textbook. See, for example, an yellowed sheet of paper from my archive where, in 1990, I drew the voltage diagram of a resistor voltage summer:
- 
- It is more convenient to display only the shell of the diagram. Thus a triangle is obtained in which the vertical leg is the voltage V, the horizontal leg is the resistance R, and the angle between the hypotenuse and the horizontal leg represents the current I (another geometric representation of Ohm's law, see the Flash picture below).
- I have developed [various kinds of voltage diagrams](https://photos.app.goo.gl/aeQJAx4sqDEYDdtN8). I colored them in red (an association with pressure) to easily distinguish them from circuit diagrams drawn in black.
- Sophisticated voltage diagrams
- ------------------------------
- Later, I drew more sophisticated voltage pictures by means of Corel Draw. See, for example, the circuit of a resistor summer where the input voltage varies (I made it in the late 90's):
- 
- "Live" voltage diagrams
- -----------------------
- In 2000, I made [Flash animated circuit tutorials](https://www.circuit-fantasia.com/collections/circuit-collection/circuits/old-circuits/v-to-i-old.html) with "live"voltage diagrams that were changing proportionally to the voltage magnitude (you need [Ruffle Flash emulator](https://www.blogger.com/blog/post/edit/6662876180507761501/8403863750906537047#) to see this movie because Adobe Flash player is no longer supported).
- 
- "Reallly live" voltage diagrams
- ----------------------------
- But then I had the desire to make "real live" voltage diagrams that use actually measured voltages at several base points in the circuit. For this purpose, I used MICROLAB data acquisition system (see the [Wikibooks story about Ohm's experiment](https://en.wikibooks.org/wiki/Circuit_Idea/Walking_along_the_Resistive_Film#How_to_visualize_the_voltage_diagram_on_the_screen) and the detailed 5 min [movie](https://photos.app.goo.gl/TDUKTRKeNPoc4mMC7)):
- 
In this attractive experiment, a linear potentiometer was supplied by two DACs and the voltages of its three terminals were measured by three ADC inputs. The other points of the voltage diagram were calculated. Also, conventional voltmeters were connected.- The content is more important than form
- ---------------------------------------
- But, as in the case of [current loops](https://electrical.codidact.com/posts/284816) and [voltage bars](https://electrical.codidact.com/posts/284860), I finally came to the conclusion that content was more important than form... and I began to draw circuit diagrams with superimposed voltage pictures by hand. For example, in the [Wikibooks story about Ohm's experiment](https://en.wikibooks.org/wiki/Circuit_Idea/Walking_along_the_Resistive_Film), I have drawn the voltage diagrams by color fiber pens on a white sheet of paper:
- 
- Voltage diagrams vs voltage bars
- --------------------------------
- What do voltage diagrams actually represent compared with voltage bars? The voltage diagram is a further development of the voltage bar representation. Voltage bars are a one-dimensional way of representing voltages while the voltage diagram is a two-dimensional way. The voltage diagram is a set of voltage bars.
- The voltage diagram is based on a linearly distributed resistance along the length of the resistor. In most cases this representation is artificial, because ordinary resistors in electronic circuits are discrete; but it allows to illustrate the circuit operation with voltage diagram. In many cases, quantitative parameters (transfer ratios, etc.) can be directly seen.
- What is the difference between a voltage diagram and voltage oscillogram at a given point in the diagram? The difference is significant, they have nothing in common. The voltage diagram shows voltage distribution along a resistance film, ie what local voltages inside a resistor are. The resistor is considered not as a "point" (without dimensions) but as a "line" (at each point of this line, in a certain step, a section perpendicular to the line is drawn, with a height proportional to the voltage at this point).
- An oscillogram is a set of points that represent voltages (by a vertical displacement) at successive points in time through. So, the particular segments of a voltage diagram represents the voltages at particular points of the resistive layer at the same time while the oscillogram shows the voltages at one point but at different points in time.
- Helping the online learning
- ---------------------------
- As I have said in the stories about [current loops](https://electrical.codidact.com/posts/284816) and [voltage bars](https://electrical.codidact.com/posts/284860), a year ago, when we switched to online learning, I started using the ZOOM pen to draw on existing web circuit diagrams. This turned out to be a very powerful didactic technique that I managed to improve even more on the last exercise. I will show you how this happened at the final part of the last exercise (11.11.21) on Semiconductor Devices with group 49a, ITI, FCST of Technical University of Sofia. I make full video recordings of ZOOM meetings with my students and, with their permission, I will use a link to the [latest record](https://photos.app.goo.gl/bGLcshsiVdYn4WhS6) (in Bulgarian). Here is also a snapshot of ZOOM whiteborad (really, the picture is not so beautiful... but attractive:-)
- 
- In another snapshot, I have drawn the Ohm's triangle on the resistive wire (the vertical leg is the voltage V, the horizontal leg is the resistance R, and the angle between the hypotenuse and the horizontal leg represents the current I):
- 
- It will be interesting for me to know your opinion about this didactic technique.
- Need to visualize voltage distribution
- --------------------------------------
- Once visualized the [voltages at the internal circuit points](https://electrical.codidact.com/posts/284860), we can go even further and "enter" inside resistors to visualize the voltages across the resistive film. This will allow us to see some interesting points (for example, virtual ground), the operation of well-known electrical devices (potentiometer, resistive summer) and electronic circuits (inverting, non-inverting, differential and instrumentation amplifiers).
- First ideas
- -----------
- This idea came to me in the early 90's. Then, for the purposes of intuitive understanding, I began representing local voltages inside resistors by a set of vertical segments whose length (height) was proportional to the local voltage magnitude (I named it voltage diagram). This notion of voltage came from a [hydraulic analogy](https://en.wikibooks.org/wiki/Circuit_Idea/Walking_along_the_Resistive_Film#Hydraulic_analogy:_Pressure_diagram) (a garden hose with evenly drilled holes) which I had seen in an old Electrical Engineering textbook. See, for example, an yellowed sheet of paper from my archive where, in 1990, I drew the voltage diagram of a resistor voltage summer:
- 
- It is more convenient to display only the shell of the diagram. Thus a triangle is obtained in which the vertical leg is the voltage V, the horizontal leg is the resistance R, and the angle between the hypotenuse and the horizontal leg represents the current I (another geometric representation of Ohm's law, see the Flash picture below).
- I have developed [various kinds of voltage diagrams](https://photos.app.goo.gl/aeQJAx4sqDEYDdtN8). I colored them in red (an association with pressure) to easily distinguish them from circuit diagrams drawn in black.
- Sophisticated voltage diagrams
- ------------------------------
- Later, I drew more sophisticated voltage pictures by means of Corel Draw. See, for example, the circuit of a resistor summer where the input voltage varies (I made it in the late 90's):
- 
- "Live" voltage diagrams
- -----------------------
- In 2000, I made [Flash animated circuit tutorials](https://www.circuit-fantasia.com/collections/circuit-collection/circuits/old-circuits/v-to-i-old.html) with "live"voltage diagrams that were changing proportionally to the voltage magnitude (you need [Ruffle Flash emulator](https://www.blogger.com/blog/post/edit/6662876180507761501/8403863750906537047#) to see this movie because Adobe Flash player is no longer supported).
- 
- "Reallly live" voltage diagrams
- ----------------------------
- But then I had the desire to make "real live" voltage diagrams that use actually measured voltages at several base points in the circuit. For this purpose, I used MICROLAB data acquisition system (see the [Wikibooks story about Ohm's experiment](https://en.wikibooks.org/wiki/Circuit_Idea/Walking_along_the_Resistive_Film#How_to_visualize_the_voltage_diagram_on_the_screen) and the detailed 5 min [movie](https://photos.app.goo.gl/TDUKTRKeNPoc4mMC7)):
- 
- In this attractive experiment, a linear potentiometer was supplied by two DACs and the voltages of its three terminals (E1 of the left end, E2 of the right end and E3 of the wiper) were measured by three ADC inputs. The other points of the voltage diagram were calculated. Also, conventional voltmeters were connected.
- The content is more important than form
- ---------------------------------------
- But, as in the case of [current loops](https://electrical.codidact.com/posts/284816) and [voltage bars](https://electrical.codidact.com/posts/284860), I finally came to the conclusion that content was more important than form... and I began to draw circuit diagrams with superimposed voltage pictures by hand. For example, in the [Wikibooks story about Ohm's experiment](https://en.wikibooks.org/wiki/Circuit_Idea/Walking_along_the_Resistive_Film), I have drawn the voltage diagrams by color fiber pens on a white sheet of paper:
- 
- Voltage diagrams vs voltage bars
- --------------------------------
- What do voltage diagrams actually represent compared with voltage bars? The voltage diagram is a further development of the voltage bar representation. Voltage bars are a one-dimensional way of representing voltages while the voltage diagram is a two-dimensional way. The voltage diagram is a set of voltage bars.
- The voltage diagram is based on a linearly distributed resistance along the length of the resistor. In most cases this representation is artificial, because ordinary resistors in electronic circuits are discrete; but it allows to illustrate the circuit operation with voltage diagram. In many cases, quantitative parameters (transfer ratios, etc.) can be directly seen.
- What is the difference between a voltage diagram and voltage oscillogram at a given point in the diagram? The difference is significant, they have nothing in common. The voltage diagram shows voltage distribution along a resistance film, ie what local voltages inside a resistor are. The resistor is considered not as a "point" (without dimensions) but as a "line" (at each point of this line, in a certain step, a section perpendicular to the line is drawn, with a height proportional to the voltage at this point).
- An oscillogram is a set of points that represent voltages (by a vertical displacement) at successive points in time through. So, the particular segments of a voltage diagram represents the voltages at particular points of the resistive layer at the same time while the oscillogram shows the voltages at one point but at different points in time.
- Helping the online learning
- ---------------------------
- As I have said in the stories about [current loops](https://electrical.codidact.com/posts/284816) and [voltage bars](https://electrical.codidact.com/posts/284860), a year ago, when we switched to online learning, I started using the ZOOM pen to draw on existing web circuit diagrams. This turned out to be a very powerful didactic technique that I managed to improve even more on the last exercise. I will show you how this happened at the final part of the last exercise (11.11.21) on Semiconductor Devices with group 49a, ITI, FCST of Technical University of Sofia. I make full video recordings of ZOOM meetings with my students and, with their permission, I will use a link to the [latest record](https://photos.app.goo.gl/bGLcshsiVdYn4WhS6) (in Bulgarian). Here is also a snapshot of ZOOM whiteborad (really, the picture is not so beautiful... but attractive:-)
- 
- In another snapshot, I have drawn the Ohm's triangle on the resistive wire (the vertical leg is the voltage V, the horizontal leg is the resistance R, and the angle between the hypotenuse and the horizontal leg represents the current I):
- 
- It will be interesting for me to know your opinion about this didactic technique.
#2: Post edited
by
Circuit fantasist
·
2021-11-13T18:38:42Z (over 3 years ago)
Added more explanations
- Need to visualize voltage distribution
- --------------------------------------
- Once visualized the [voltages at the internal circuit points](https://electrical.codidact.com/posts/284860), we can go even further and "enter" inside resistors to visualize the voltages across the resistive film. This will allow us to see some interesting points (for example, virtual ground), the operation of well-known electrical devices (potentiometer, resistive summer) and electronic circuits (inverting, non-inverting, differential and instrumentation amplifiers).
- First ideas
- -----------
- This idea came to me in the early 90's. Then, for the purposes of intuitive understanding, I began representing local voltages inside resistors by a set of vertical segments whose length (height) was proportional to the local voltage magnitude (I named it voltage diagram). This notion of voltage came from a [hydraulic analogy](https://en.wikibooks.org/wiki/Circuit_Idea/Walking_along_the_Resistive_Film#Hydraulic_analogy:_Pressure_diagram) (a garden hose with evenly drilled holes) which I had seen in an old Electrical Engineering textbook. See, for example, an yellowed sheet of paper from my archive where, in 1990, I drew the voltage diagram of a resistor voltage summer:
- 
- It is more convenient to display only the shell of the diagram. Thus a triangle is obtained in which the vertical leg is the voltage V, the horizontal leg is the resistance R, and the angle between the hypotenuse and the horizontal leg represents the current I (another geometric representation of Ohm's law, see the Flash picture below).
- I have developed [various kinds of voltage diagrams](https://photos.app.goo.gl/aeQJAx4sqDEYDdtN8). I colored them in red (an association with pressure) to easily distinguish them from circuit diagrams drawn in black.
- Sophisticated voltage diagrams
- ------------------------------
- Later, I drew more sophisticated voltage pictures by means of Corel Draw. See, for example, the circuit of a resistor summer where the input voltage varies (I made it in the late 90's):
- 
- "Live" voltage diagrams
- -----------------------
- In 2000, I made [Flash animated circuit tutorials](https://www.circuit-fantasia.com/collections/circuit-collection/circuits/old-circuits/v-to-i-old.html) with "live"voltage diagrams that were changing proportionally to the voltage magnitude (you need [Ruffle Flash emulator](https://www.blogger.com/blog/post/edit/6662876180507761501/8403863750906537047#) to see this movie because Adobe Flash player is no longer supported).
- 
- "Reallly live" voltage diagrams
- ----------------------------
- But then I had the desire to make "real live" voltage diagrams that use actually measured voltages at several base points in the circuit. For this purpose, I used MICROLAB data acquisition system (see the [Wikibooks story about Ohm's experiment](https://en.wikibooks.org/wiki/Circuit_Idea/Walking_along_the_Resistive_Film#How_to_visualize_the_voltage_diagram_on_the_screen) and the detailed 5 min [movie](https://photos.app.goo.gl/TDUKTRKeNPoc4mMC7)):
- 
- The content is more important than form
- ---------------------------------------
- But, as in the case of [current loops](https://electrical.codidact.com/posts/284816) and [voltage bars](https://electrical.codidact.com/posts/284860), I finally came to the conclusion that content was more important than form... and I began to draw circuit diagrams with superimposed voltage pictures by hand. For example, in the [Wikibooks story about Ohm's experiment](https://en.wikibooks.org/wiki/Circuit_Idea/Walking_along_the_Resistive_Film), I have drawn the voltage diagrams by color fiber pens on a white sheet of paper:
- 
- Voltage diagrams vs voltage bars
- --------------------------------
- What do voltage diagrams actually represent compared with voltage bars? The voltage diagram is a further development of the voltage bar representation. Voltage bars are a one-dimensional way of representing voltages while the voltage diagram is a two-dimensional way. The voltage diagram is a set of voltage bars.
- The voltage diagram is based on a linearly distributed resistance along the length of the resistor. In most cases this representation is artificial, because ordinary resistors in electronic circuits are discrete; but it allows to illustrate the circuit operation with voltage diagram. In many cases, quantitative parameters (transfer ratios, etc.) can be directly seen.
- What is the difference between a voltage diagram and voltage oscillogram at a given point in the diagram? The difference is significant, they have nothing in common. The voltage diagram shows voltage distribution along a resistance film, ie what local voltages inside a resistor are. The resistor is considered not as a "point" (without dimensions) but as a "line" (at each point of this line, in a certain step, a section perpendicular to the line is drawn, with a height proportional to the voltage at this point).
- An oscillogram is a set of points that represent voltages (by a vertical displacement) at successive points in time through. So, the particular segments of a voltage diagram represents the voltages at particular points of the resistive layer at the same time while the oscillogram shows the voltages at one point but at different points in time.
- Helping the online learning
- ---------------------------
- As I have said in the stories about [current loops](https://electrical.codidact.com/posts/284816) and [voltage bars](https://electrical.codidact.com/posts/284860), a year ago, when we switched to online learning, I started using the ZOOM pen to draw on existing web circuit diagrams. This turned out to be a very powerful didactic technique that I managed to improve even more on the last exercise. I will show you how this happened at the final part of the last exercise (11.11.21) on Semiconductor Devices with group 49a, ITI, FCST of Technical University of Sofia. I make full video recordings of ZOOM meetings with my students and, with their permission, I will use a link to the [latest record](https://photos.app.goo.gl/bGLcshsiVdYn4WhS6) (in Bulgarian). Here is also a snapshot of ZOOM whiteborad (really, the picture is not so beautiful... but attractive:-)
- 
- In another snapshot, I have drawn the Ohm's triangle on the resistive wire (the vertical leg is the voltage V, the horizontal leg is the resistance R, and the angle between the hypotenuse and the horizontal leg represents the current I):
- 
- It will be interesting for me to know your opinion about this didactic technique.
- Need to visualize voltage distribution
- --------------------------------------
- Once visualized the [voltages at the internal circuit points](https://electrical.codidact.com/posts/284860), we can go even further and "enter" inside resistors to visualize the voltages across the resistive film. This will allow us to see some interesting points (for example, virtual ground), the operation of well-known electrical devices (potentiometer, resistive summer) and electronic circuits (inverting, non-inverting, differential and instrumentation amplifiers).
- First ideas
- -----------
- This idea came to me in the early 90's. Then, for the purposes of intuitive understanding, I began representing local voltages inside resistors by a set of vertical segments whose length (height) was proportional to the local voltage magnitude (I named it voltage diagram). This notion of voltage came from a [hydraulic analogy](https://en.wikibooks.org/wiki/Circuit_Idea/Walking_along_the_Resistive_Film#Hydraulic_analogy:_Pressure_diagram) (a garden hose with evenly drilled holes) which I had seen in an old Electrical Engineering textbook. See, for example, an yellowed sheet of paper from my archive where, in 1990, I drew the voltage diagram of a resistor voltage summer:
- 
- It is more convenient to display only the shell of the diagram. Thus a triangle is obtained in which the vertical leg is the voltage V, the horizontal leg is the resistance R, and the angle between the hypotenuse and the horizontal leg represents the current I (another geometric representation of Ohm's law, see the Flash picture below).
- I have developed [various kinds of voltage diagrams](https://photos.app.goo.gl/aeQJAx4sqDEYDdtN8). I colored them in red (an association with pressure) to easily distinguish them from circuit diagrams drawn in black.
- Sophisticated voltage diagrams
- ------------------------------
- Later, I drew more sophisticated voltage pictures by means of Corel Draw. See, for example, the circuit of a resistor summer where the input voltage varies (I made it in the late 90's):
- 
- "Live" voltage diagrams
- -----------------------
- In 2000, I made [Flash animated circuit tutorials](https://www.circuit-fantasia.com/collections/circuit-collection/circuits/old-circuits/v-to-i-old.html) with "live"voltage diagrams that were changing proportionally to the voltage magnitude (you need [Ruffle Flash emulator](https://www.blogger.com/blog/post/edit/6662876180507761501/8403863750906537047#) to see this movie because Adobe Flash player is no longer supported).
- 
- "Reallly live" voltage diagrams
- ----------------------------
- But then I had the desire to make "real live" voltage diagrams that use actually measured voltages at several base points in the circuit. For this purpose, I used MICROLAB data acquisition system (see the [Wikibooks story about Ohm's experiment](https://en.wikibooks.org/wiki/Circuit_Idea/Walking_along_the_Resistive_Film#How_to_visualize_the_voltage_diagram_on_the_screen) and the detailed 5 min [movie](https://photos.app.goo.gl/TDUKTRKeNPoc4mMC7)):
- 
- In this attractive experiment, a linear potentiometer was supplied by two DACs and the voltages of its three terminals were measured by three ADC inputs. The other points of the voltage diagram were calculated. Also, conventional voltmeters were connected.
- The content is more important than form
- ---------------------------------------
- But, as in the case of [current loops](https://electrical.codidact.com/posts/284816) and [voltage bars](https://electrical.codidact.com/posts/284860), I finally came to the conclusion that content was more important than form... and I began to draw circuit diagrams with superimposed voltage pictures by hand. For example, in the [Wikibooks story about Ohm's experiment](https://en.wikibooks.org/wiki/Circuit_Idea/Walking_along_the_Resistive_Film), I have drawn the voltage diagrams by color fiber pens on a white sheet of paper:
- 
- Voltage diagrams vs voltage bars
- --------------------------------
- What do voltage diagrams actually represent compared with voltage bars? The voltage diagram is a further development of the voltage bar representation. Voltage bars are a one-dimensional way of representing voltages while the voltage diagram is a two-dimensional way. The voltage diagram is a set of voltage bars.
- The voltage diagram is based on a linearly distributed resistance along the length of the resistor. In most cases this representation is artificial, because ordinary resistors in electronic circuits are discrete; but it allows to illustrate the circuit operation with voltage diagram. In many cases, quantitative parameters (transfer ratios, etc.) can be directly seen.
- What is the difference between a voltage diagram and voltage oscillogram at a given point in the diagram? The difference is significant, they have nothing in common. The voltage diagram shows voltage distribution along a resistance film, ie what local voltages inside a resistor are. The resistor is considered not as a "point" (without dimensions) but as a "line" (at each point of this line, in a certain step, a section perpendicular to the line is drawn, with a height proportional to the voltage at this point).
- An oscillogram is a set of points that represent voltages (by a vertical displacement) at successive points in time through. So, the particular segments of a voltage diagram represents the voltages at particular points of the resistive layer at the same time while the oscillogram shows the voltages at one point but at different points in time.
- Helping the online learning
- ---------------------------
- As I have said in the stories about [current loops](https://electrical.codidact.com/posts/284816) and [voltage bars](https://electrical.codidact.com/posts/284860), a year ago, when we switched to online learning, I started using the ZOOM pen to draw on existing web circuit diagrams. This turned out to be a very powerful didactic technique that I managed to improve even more on the last exercise. I will show you how this happened at the final part of the last exercise (11.11.21) on Semiconductor Devices with group 49a, ITI, FCST of Technical University of Sofia. I make full video recordings of ZOOM meetings with my students and, with their permission, I will use a link to the [latest record](https://photos.app.goo.gl/bGLcshsiVdYn4WhS6) (in Bulgarian). Here is also a snapshot of ZOOM whiteborad (really, the picture is not so beautiful... but attractive:-)
- 
- In another snapshot, I have drawn the Ohm's triangle on the resistive wire (the vertical leg is the voltage V, the horizontal leg is the resistance R, and the angle between the hypotenuse and the horizontal leg represents the current I):
- 
- It will be interesting for me to know your opinion about this didactic technique.
#1: Post edited
by
Circuit fantasist
·
2021-11-13T18:19:32Z (over 3 years ago)
Corrected link
- Need to visualize voltage distribution
- --------------------------------------
- Once visualized the [voltages at the internal circuit points](https://electrical.codidact.com/posts/284860), we can go even further and "enter" inside resistors to visualize the voltages across the resistive film. This will allow us to see some interesting points (for example, virtual ground), the operation of well-known electrical devices (potentiometer, resistive summer) and electronic circuits (inverting, non-inverting, differential and instrumentation amplifiers).
- First ideas
- -----------
- This idea came to me in the early 90's. Then, for the purposes of intuitive understanding, I began representing local voltages inside resistors by a set of vertical segments whose length (height) was proportional to the local voltage magnitude (I named it voltage diagram). This notion of voltage came from a [hydraulic analogy](https://en.wikibooks.org/wiki/Circuit_Idea/Walking_along_the_Resistive_Film#Hydraulic_analogy:_Pressure_diagram) (a garden hose with evenly drilled holes) which I had seen in an old Electrical Engineering textbook. See, for example, an yellowed sheet of paper from my archive where, in 1990, I drew the voltage diagram of a resistor voltage summer:
- 
- It is more convenient to display only the shell of the diagram. Thus a triangle is obtained in which the vertical leg is the voltage V, the horizontal leg is the resistance R, and the angle between the hypotenuse and the horizontal leg represents the current I (another geometric representation of Ohm's law, see the Flash picture below).
- I have developed [various kinds of voltage diagrams](https://photos.app.goo.gl/aeQJAx4sqDEYDdtN8). I colored them in red (an association with pressure) to easily distinguish them from circuit diagrams drawn in black.
- Sophisticated voltage diagrams
- ------------------------------
- Later, I drew more sophisticated voltage pictures by means of Corel Draw. See, for example, the circuit of a resistor summer where the input voltage varies (I made it in the late 90's):
- 
- "Live" voltage diagrams
- -----------------------
In 2000, I made [Flash animated circuit tutorials](https://www.blogger.com/blog/post/edit/6662876180507761501/8403863750906537047#) with "live"voltage diagrams that were changing proportionally to the voltage magnitude (you need [Ruffle Flash emulator](https://www.blogger.com/blog/post/edit/6662876180507761501/8403863750906537047#) to see this movie because Adobe Flash player is no longer supported).- 
- "Reallly live" voltage diagrams
- ----------------------------
- But then I had the desire to make "real live" voltage diagrams that use actually measured voltages at several base points in the circuit. For this purpose, I used MICROLAB data acquisition system (see the [Wikibooks story about Ohm's experiment](https://en.wikibooks.org/wiki/Circuit_Idea/Walking_along_the_Resistive_Film#How_to_visualize_the_voltage_diagram_on_the_screen) and the detailed 5 min [movie](https://photos.app.goo.gl/TDUKTRKeNPoc4mMC7)):
- 
- The content is more important than form
- ---------------------------------------
- But, as in the case of [current loops](https://electrical.codidact.com/posts/284816) and [voltage bars](https://electrical.codidact.com/posts/284860), I finally came to the conclusion that content was more important than form... and I began to draw circuit diagrams with superimposed voltage pictures by hand. For example, in the [Wikibooks story about Ohm's experiment](https://en.wikibooks.org/wiki/Circuit_Idea/Walking_along_the_Resistive_Film), I have drawn the voltage diagrams by color fiber pens on a white sheet of paper:
- 
- Voltage diagrams vs voltage bars
- --------------------------------
- What do voltage diagrams actually represent compared with voltage bars? The voltage diagram is a further development of the voltage bar representation. Voltage bars are a one-dimensional way of representing voltages while the voltage diagram is a two-dimensional way. The voltage diagram is a set of voltage bars.
- The voltage diagram is based on a linearly distributed resistance along the length of the resistor. In most cases this representation is artificial, because ordinary resistors in electronic circuits are discrete; but it allows to illustrate the circuit operation with voltage diagram. In many cases, quantitative parameters (transfer ratios, etc.) can be directly seen.
- What is the difference between a voltage diagram and voltage oscillogram at a given point in the diagram? The difference is significant, they have nothing in common. The voltage diagram shows voltage distribution along a resistance film, ie what local voltages inside a resistor are. The resistor is considered not as a "point" (without dimensions) but as a "line" (at each point of this line, in a certain step, a section perpendicular to the line is drawn, with a height proportional to the voltage at this point).
- An oscillogram is a set of points that represent voltages (by a vertical displacement) at successive points in time through. So, the particular segments of a voltage diagram represents the voltages at particular points of the resistive layer at the same time while the oscillogram shows the voltages at one point but at different points in time.
- Helping the online learning
- ---------------------------
- As I have said in the stories about [current loops](https://electrical.codidact.com/posts/284816) and [voltage bars](https://electrical.codidact.com/posts/284860), a year ago, when we switched to online learning, I started using the ZOOM pen to draw on existing web circuit diagrams. This turned out to be a very powerful didactic technique that I managed to improve even more on the last exercise. I will show you how this happened at the final part of the last exercise (11.11.21) on Semiconductor Devices with group 49a, ITI, FCST of Technical University of Sofia. I make full video recordings of ZOOM meetings with my students and, with their permission, I will use a link to the [latest record](https://photos.app.goo.gl/bGLcshsiVdYn4WhS6) (in Bulgarian). Here is also a snapshot of ZOOM whiteborad (really, the picture is not so beautiful... but attractive:-)
- 
- In another snapshot, I have drawn the Ohm's triangle on the resistive wire (the vertical leg is the voltage V, the horizontal leg is the resistance R, and the angle between the hypotenuse and the horizontal leg represents the current I):
- 
- It will be interesting for me to know your opinion about this didactic technique.
- Need to visualize voltage distribution
- --------------------------------------
- Once visualized the [voltages at the internal circuit points](https://electrical.codidact.com/posts/284860), we can go even further and "enter" inside resistors to visualize the voltages across the resistive film. This will allow us to see some interesting points (for example, virtual ground), the operation of well-known electrical devices (potentiometer, resistive summer) and electronic circuits (inverting, non-inverting, differential and instrumentation amplifiers).
- First ideas
- -----------
- This idea came to me in the early 90's. Then, for the purposes of intuitive understanding, I began representing local voltages inside resistors by a set of vertical segments whose length (height) was proportional to the local voltage magnitude (I named it voltage diagram). This notion of voltage came from a [hydraulic analogy](https://en.wikibooks.org/wiki/Circuit_Idea/Walking_along_the_Resistive_Film#Hydraulic_analogy:_Pressure_diagram) (a garden hose with evenly drilled holes) which I had seen in an old Electrical Engineering textbook. See, for example, an yellowed sheet of paper from my archive where, in 1990, I drew the voltage diagram of a resistor voltage summer:
- 
- It is more convenient to display only the shell of the diagram. Thus a triangle is obtained in which the vertical leg is the voltage V, the horizontal leg is the resistance R, and the angle between the hypotenuse and the horizontal leg represents the current I (another geometric representation of Ohm's law, see the Flash picture below).
- I have developed [various kinds of voltage diagrams](https://photos.app.goo.gl/aeQJAx4sqDEYDdtN8). I colored them in red (an association with pressure) to easily distinguish them from circuit diagrams drawn in black.
- Sophisticated voltage diagrams
- ------------------------------
- Later, I drew more sophisticated voltage pictures by means of Corel Draw. See, for example, the circuit of a resistor summer where the input voltage varies (I made it in the late 90's):
- 
- "Live" voltage diagrams
- -----------------------
- In 2000, I made [Flash animated circuit tutorials](https://www.circuit-fantasia.com/collections/circuit-collection/circuits/old-circuits/v-to-i-old.html) with "live"voltage diagrams that were changing proportionally to the voltage magnitude (you need [Ruffle Flash emulator](https://www.blogger.com/blog/post/edit/6662876180507761501/8403863750906537047#) to see this movie because Adobe Flash player is no longer supported).
- 
- "Reallly live" voltage diagrams
- ----------------------------
- But then I had the desire to make "real live" voltage diagrams that use actually measured voltages at several base points in the circuit. For this purpose, I used MICROLAB data acquisition system (see the [Wikibooks story about Ohm's experiment](https://en.wikibooks.org/wiki/Circuit_Idea/Walking_along_the_Resistive_Film#How_to_visualize_the_voltage_diagram_on_the_screen) and the detailed 5 min [movie](https://photos.app.goo.gl/TDUKTRKeNPoc4mMC7)):
- 
- The content is more important than form
- ---------------------------------------
- But, as in the case of [current loops](https://electrical.codidact.com/posts/284816) and [voltage bars](https://electrical.codidact.com/posts/284860), I finally came to the conclusion that content was more important than form... and I began to draw circuit diagrams with superimposed voltage pictures by hand. For example, in the [Wikibooks story about Ohm's experiment](https://en.wikibooks.org/wiki/Circuit_Idea/Walking_along_the_Resistive_Film), I have drawn the voltage diagrams by color fiber pens on a white sheet of paper:
- 
- Voltage diagrams vs voltage bars
- --------------------------------
- What do voltage diagrams actually represent compared with voltage bars? The voltage diagram is a further development of the voltage bar representation. Voltage bars are a one-dimensional way of representing voltages while the voltage diagram is a two-dimensional way. The voltage diagram is a set of voltage bars.
- The voltage diagram is based on a linearly distributed resistance along the length of the resistor. In most cases this representation is artificial, because ordinary resistors in electronic circuits are discrete; but it allows to illustrate the circuit operation with voltage diagram. In many cases, quantitative parameters (transfer ratios, etc.) can be directly seen.
- What is the difference between a voltage diagram and voltage oscillogram at a given point in the diagram? The difference is significant, they have nothing in common. The voltage diagram shows voltage distribution along a resistance film, ie what local voltages inside a resistor are. The resistor is considered not as a "point" (without dimensions) but as a "line" (at each point of this line, in a certain step, a section perpendicular to the line is drawn, with a height proportional to the voltage at this point).
- An oscillogram is a set of points that represent voltages (by a vertical displacement) at successive points in time through. So, the particular segments of a voltage diagram represents the voltages at particular points of the resistive layer at the same time while the oscillogram shows the voltages at one point but at different points in time.
- Helping the online learning
- ---------------------------
- As I have said in the stories about [current loops](https://electrical.codidact.com/posts/284816) and [voltage bars](https://electrical.codidact.com/posts/284860), a year ago, when we switched to online learning, I started using the ZOOM pen to draw on existing web circuit diagrams. This turned out to be a very powerful didactic technique that I managed to improve even more on the last exercise. I will show you how this happened at the final part of the last exercise (11.11.21) on Semiconductor Devices with group 49a, ITI, FCST of Technical University of Sofia. I make full video recordings of ZOOM meetings with my students and, with their permission, I will use a link to the [latest record](https://photos.app.goo.gl/bGLcshsiVdYn4WhS6) (in Bulgarian). Here is also a snapshot of ZOOM whiteborad (really, the picture is not so beautiful... but attractive:-)
- 
- In another snapshot, I have drawn the Ohm's triangle on the resistive wire (the vertical leg is the voltage V, the horizontal leg is the resistance R, and the angle between the hypotenuse and the horizontal leg represents the current I):
- 
- It will be interesting for me to know your opinion about this didactic technique.