Communities

Writing
Writing
Codidact Meta
Codidact Meta
The Great Outdoors
The Great Outdoors
Photography & Video
Photography & Video
Scientific Speculation
Cooking
Cooking
Electrical Engineering
Judaism
Judaism
Languages & Linguistics
Software Development
Mathematics
Mathematics
Christianity
Christianity
Code Golf
Code Golf
Music
Music
Physics
Physics
Linux Systems
Linux Systems
Power Users
Power Users
Tabletop RPGs
Tabletop RPGs
Community Proposals
Community Proposals
tag:snake search within a tag
answers:0 unanswered questions
user:xxxx search by author id
score:0.5 posts with 0.5+ score
"snake oil" exact phrase
votes:4 posts with 4+ votes
created:<1w created < 1 week ago
post_type:xxxx type of post
Search help
Notifications
Mark all as read See all your notifications »
Q&A

Comments on Unexpected impedance spike when paralleling capacitors

Parent

Unexpected impedance spike when paralleling capacitors

+5
−0

I was watching a video from EEVBLOG about bypass capacitors, and he presented a theory that randomly connecting different values of capacitors in parallel can create unexpected impedance spikes: Image alt text To inspect the picture, right click and open in new tab, the scales are then visible. Regardless: The frequency scale is logarithmic, impedance scale is linear. Both graphs have 100kHz-40MHz frequency range, and the spike on the left side is located at 8Mhz point, reaching ~800mOhm impedance.

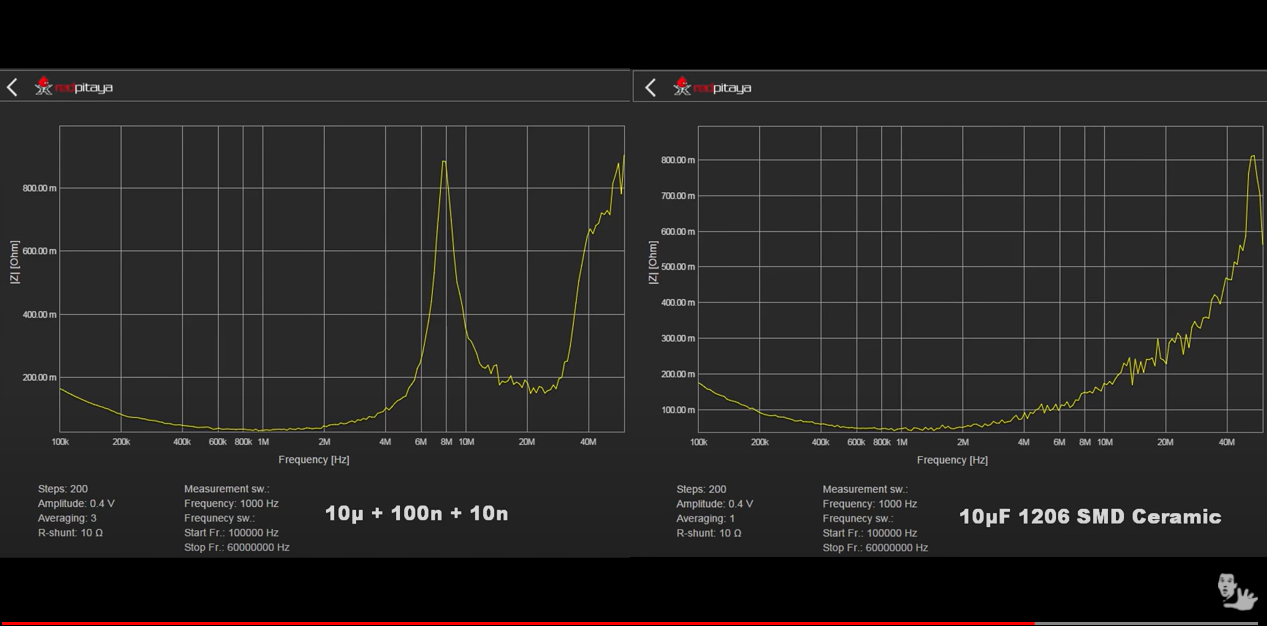
However, he did not explain why the spike is there. Thinking about it some more, I could not come up with an explanation other than bad test setup. Resistance and inductance go down as more values are added in parallel. Although total capacitance goes up, which would lower the total resonance frequency, 110nF in relation to 10uF cannot cause such a drastic shift.

This was his test setup: Image alt text

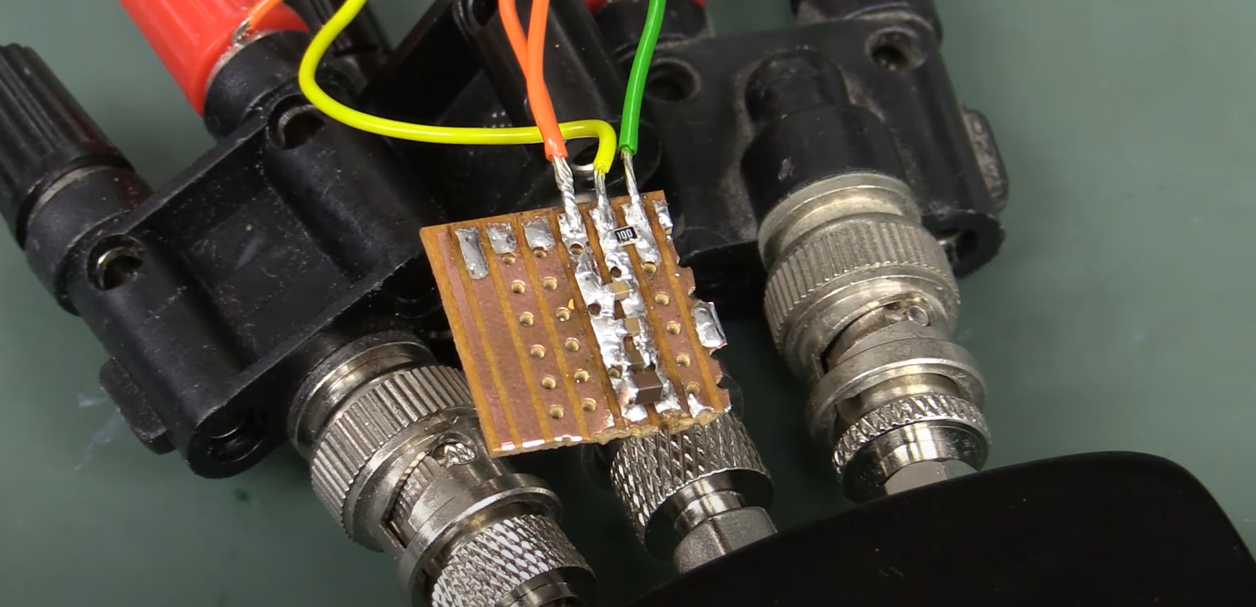
I assume that the solder blobs between capacitors introduced a series inductance that in turn caused the spike in impedance at 8MHz.

Could that be the case, or is there something else that could cause the spike?

History
Why does this post require moderator attention?
You might want to add some details to your flag.
Why should this post be closed?

0 comment threads

Post
+4
−0

Unfortunately the frequency legend on your graphs are too small to see, so we don't know how the left and right graphs relate to each other.

However, what is certainly going on in the left graph is a LC resonance. Again, it would be useful to know where that peak is in relation to the right graph. If it's way over to the right, then that shouldn't be too surprising.

Adding more capacitance should in theory lower the impedance everywhere. However, phase shifts also occur. Put another way, when you are getting near the non-ideal behavior of the capacitors, you have to consider the complex impedances and how they combine in the complex plane.

Something that might help with intuition is to consider an ideal parallel LC circuit. Looking at just the capacitance, the impedance magnitude goes steadily lower with higher frequency. However, put the inductor in parallel with it and you suddenly have infinite impedance at one particular frequency.

By adding capacitance in your example, any resonant frequency due to non-ideal characteristics will get lower. It can then show up at a frequency where there was previously no peak.

History
Why does this post require moderator attention?
You might want to add some details to your flag.

1 comment thread

@#36396 I added description on how to inspect the graph in post, and also added verbal description of... (1 comment)
@#36396 I added description on how to inspect the graph in post, and also added verbal description of...
Elleanor Lopez‭ wrote almost 2 years ago

Olin Lathrop‭ I added description on how to inspect the graph in post, and also added verbal description of the graphs in case the picture cannot be opened. It is a screenshot from a video, unfortunately I don't know how to enhance quality of that. There is also a link to the video with embedded timestamp, so if that is clicked, the particular time showing graph will open