What are voltages in circuits?
Need to visualize voltages
I hope I have convinced you that a powerful technique for explaining circuits in an intuitive way is to show where currents flow. But since currents are created by voltages, it is even more important to show what voltages of the internal circuit points are.
Voltages, like currents, are invisible... and to show them, we have somehow to visualize their value and polarity (in circuit theory, voltage polarities are considered unimportant and are represented by arbitrary signs).
First ideas
That is why, in the early 90's, for the purposes of intuitive understanding, I began representing local voltages in circuits by vertical segments (voltage bars) whose length (height) is proportional to the voltage magnitude. This notion of voltage comes from the well-known water tower hydraulic analogy - a water column with a height proportional to the pressure (the higher the column, the greater the pressure). Here is a yellowed sheet of paper from my archive where, in1992, I drew the voltage bars for the circuit of a common-emitter transistor amplifier with an emitter resistor:
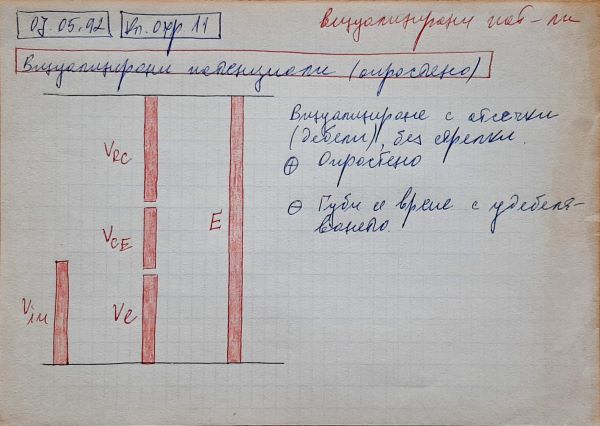
These bars can represent both single-ended voltages (with respect to the negative rail, ground or positive rail of the power supply) and "floating" voltages. Thus, some of them are firmly "tied" to ground (Vin and Ve in the figure above) or to Vcc (VRc), while others are "floating" (VCE). The relation between the voltage magnitude and the bar length is given by a scale factor with dimension [V/cm].
I have developed various voltage bars with polarity signs and arrows, etc. The zero voltage level (of ground) and other typical levels (of supply rails) are marked by horizontal dotted lines. Positive voltages are represented by bars drawn above the zero level and negative voltages are represented by bars below it. The sum of bars representing voltage drops is equal to the supply voltage (Ve + VCE + VRc = E) which simply represents KVL in a geometric form.
I colored the voltage bars in red to easily distinguish them from circuit diagrams drawn in black (the red color makes an association with pressure). Also, I made 3-D voltage pictures where I axonometrically drew the circuit diagram and placed the voltage bars perpendicular to it.
Sophisticated voltage pictures
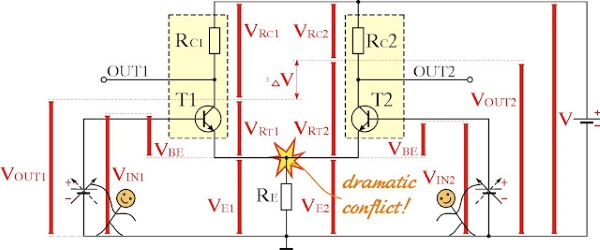
Later, I drew more sophisticated voltage pictures by means of Corel Draw. See, for example, the circuit of a differential transistor amplifier (I made it in the late 90's):
"Live" voltages
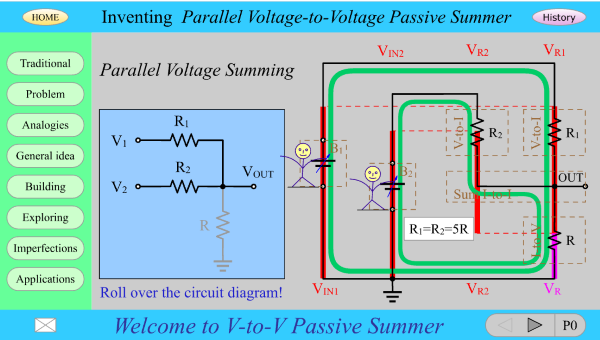
In 2000, I even made Flash animated circuit tutorials with "living"voltage bars that were changing their height proportionally to the voltage magnitude (you need Ruffle Flash emulator to see this movie because Adobe Flash player is no longer supported):
The content is more important than form
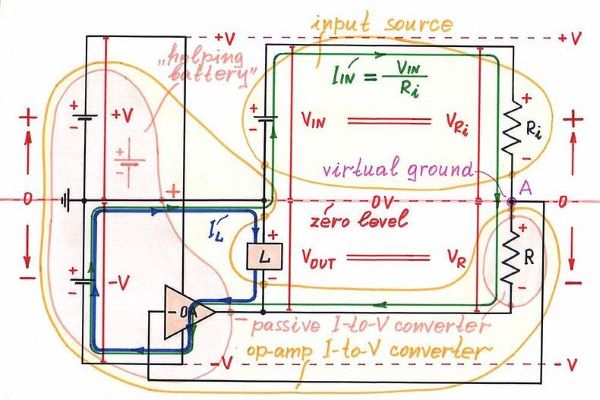
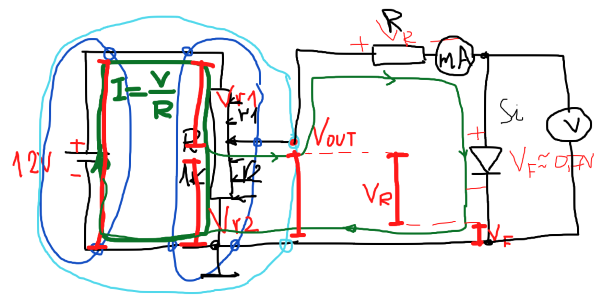
As in the case of current loops, I came to the conclusion that content was more important than form... and I began to draw circuit diagrams with superimposed voltage pictures by hand. Here is an attractive "geometrical" representation of the op-amp current-to-voltage converter aka "transimpedance amplifier". I drew it in 2006, by color fiber pens on a white sheet of paper:
And another example but on the blackboard:
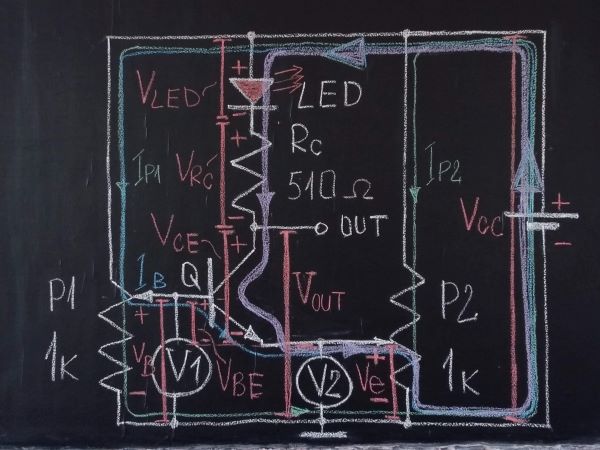
Voltage bars vs voltage oscillograms
What do voltage bars actually represent? It is a like of a "frozen picture", sort of like an image on the oscilloscope screen without a horizontal sweep. The question arises, "Wouldn't it be better to display oscillograms of the voltages at the points being controlled rather than bars?"
The advantage of bars is that voltages can be easily compared. The bars can be superimposed in height (summed) so that, according to Kirchhoff's second law, in a closed loop the sum of all the bars is equal to the largest bar - the applied supply voltage. If they are oscillograms, moments of time must be added because the oscillogram shows within a period the instantaneous values at each point in time. Visualizing with oscillograms has the advantage that only one circuit is needed, whereas here more circuits have to be drawn for different typical voltage values... but the relationships between the voltages are clearly visible. For a comparison, voltage bars are like snapshots (static frames) of individual moments of the circuit operation, whereas the oscillograms are like movies that have all the frames.
What is the benefit of representing voltages by such bars? It gives a very good general idea of circuit operation. A glance at such a circuit with a voltage picture superimposed gives an idea of voltage magnitudes at circuit points. This is an advantage over the numerical representation, which is accurate but abstract.
Helping the online learning
As I have said in the story about current loops, a year ago, when we switched to online learning, I started using the ZOOM pen to draw on existing web circuit diagrams. This turned out to be a very powerful didactic technique that I managed to improve even more on the last exercise. I will show you how this happened at the final part of the last exercise (04.11.21) on Semiconductor Devices with group 48b, ITI, FCST of Technical University of Sofia. I make full video recordings of ZOOM meetings with my students and, with their permission, I will use a link to the latest record (in Bulgarian). Here is also a snapshot of ZOOM whiteborad (really, the picture is not so beautiful... but attractive:-)
Now I would like to draw voltage bars on a picture of a real laboratory setup...
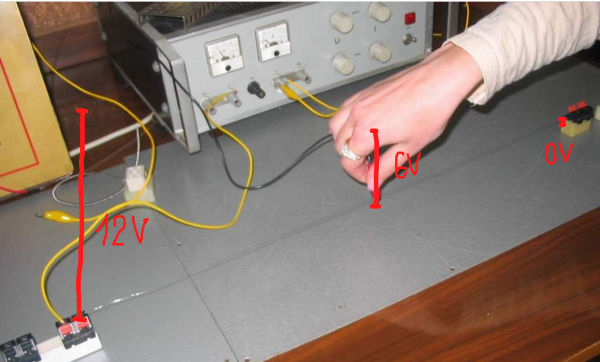
It will be interesting for me to know your opinion about this didactic technique.
See also
What are voltages inside resistors? (voltage diagram)
Where do currents flow in circuits? (current loops with proportional thickness)
Web Resources
How to Visualize Voltages in Circuits (Circuit Idea wikibook)

0 comment threads