Unexpected impedance spike when paralleling capacitors
I was watching a video from EEVBLOG about bypass capacitors, and he presented a theory that randomly connecting different values of capacitors in parallel can create unexpected impedance spikes:
However, he did not explain why the spike is there. Thinking about it some more, I could not come up with an explanation other than bad test setup. Resistance and inductance go down as more values are added in parallel. Although total capacitance goes up, which would lower the total resonance frequency, 110nF in relation to 10uF cannot cause such a drastic shift.
This was his test setup:
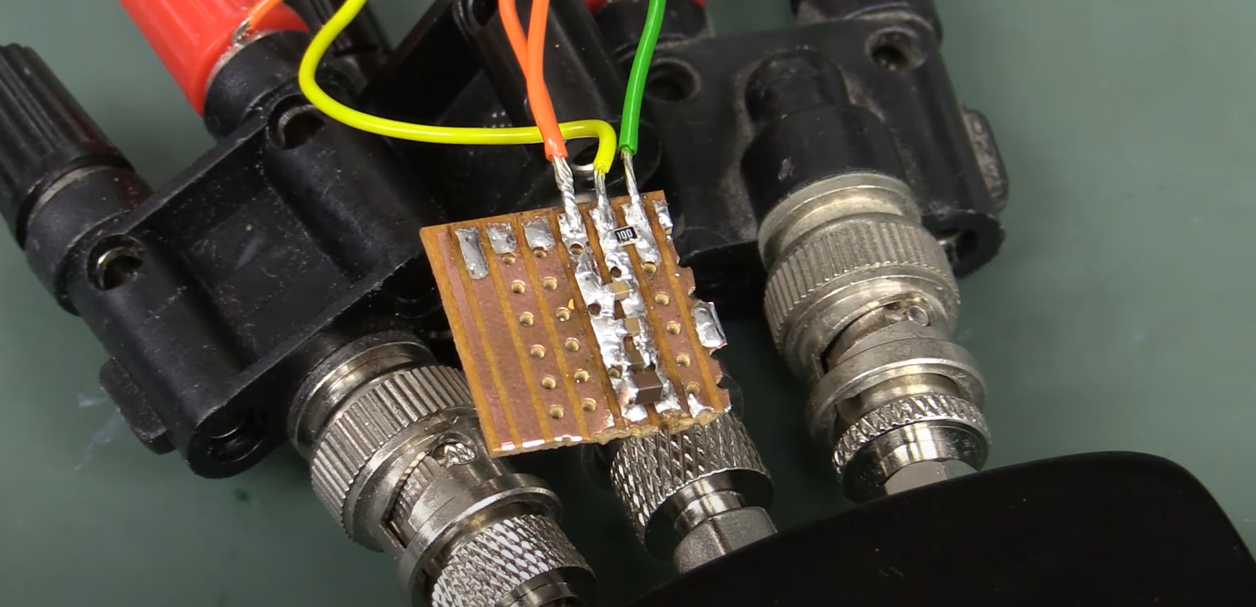
I assume that the solder blobs between capacitors introduced a series inductance that in turn caused the spike in impedance at 8MHz.
Could that be the case, or is there something else that could cause the spike?
3 answers
You are accessing this answer with a direct link, so it's being shown above all other answers regardless of its score. You can return to the normal view.
Around the 19 min mark in the video (approximately, found with hovering the cursor over the timeline) you'll see that different capacitors have different values of both capacitances and parasitics, and their combined response causes those peaks. Not lastly, there are PCB traces that come with both their characteristic impedance, and parasitics. It may be more intuitive to use a SPICE program to simulate a possible setup. Everything may look something like this:
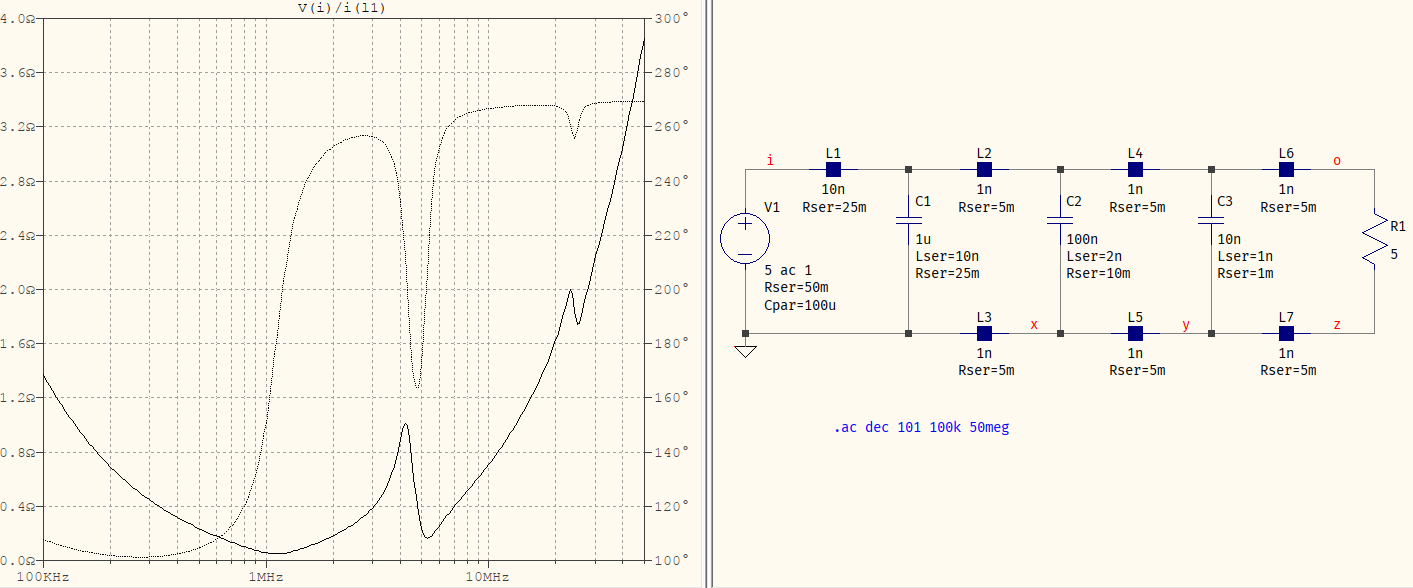
I've used some fairly sensible values: a slightly larger, but short trace from the "supply (V1) to the PCB, tightly placed capacitors with some common values for the parasitics.
If you want a mathematical analysis then feel free to go for it, but I'll warn you you'd be getting with a very fluffy expression, which is likely to obscure things, rather than not. That's why the picture above should be slightly better, and the video even more.
0 comment threads
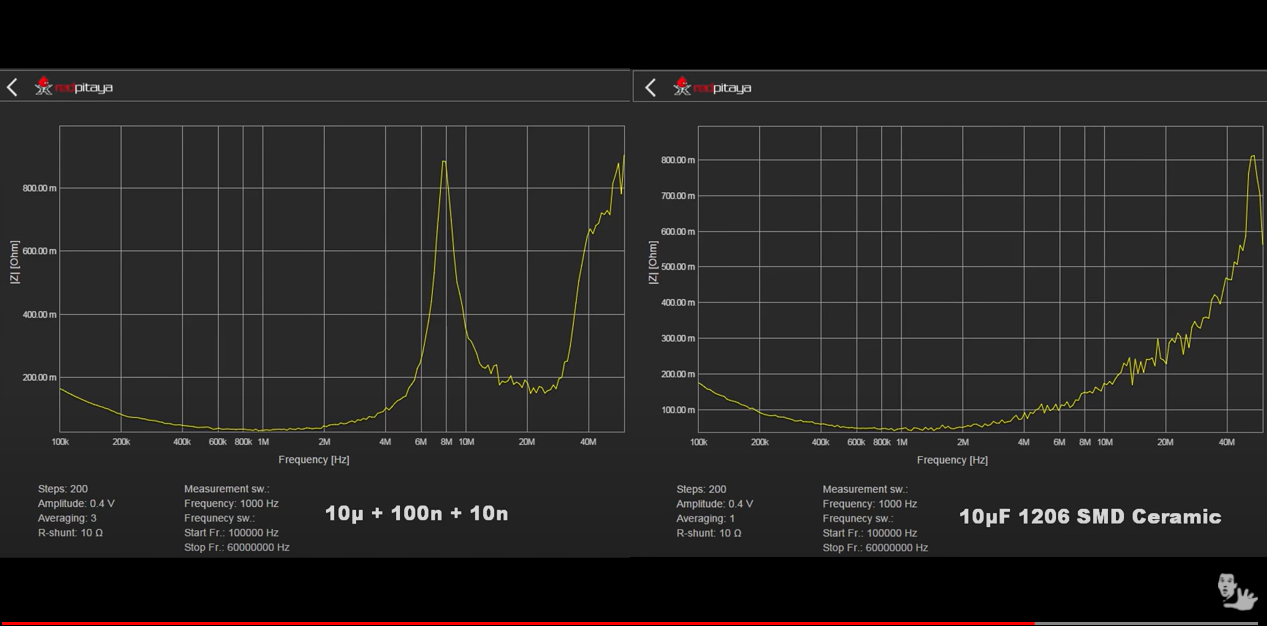
Unfortunately the frequency legend on your graphs are too small to see, so we don't know how the left and right graphs relate to each other.
However, what is certainly going on in the left graph is a LC resonance. Again, it would be useful to know where that peak is in relation to the right graph. If it's way over to the right, then that shouldn't be too surprising.
Adding more capacitance should in theory lower the impedance everywhere. However, phase shifts also occur. Put another way, when you are getting near the non-ideal behavior of the capacitors, you have to consider the complex impedances and how they combine in the complex plane.
Something that might help with intuition is to consider an ideal parallel LC circuit. Looking at just the capacitance, the impedance magnitude goes steadily lower with higher frequency. However, put the inductor in parallel with it and you suddenly have infinite impedance at one particular frequency.
By adding capacitance in your example, any resonant frequency due to non-ideal characteristics will get lower. It can then show up at a frequency where there was previously no peak.
1 comment thread
I think you can make a pretty good case for the spike being caused by the addition of the 100n and 10n capacitors: -
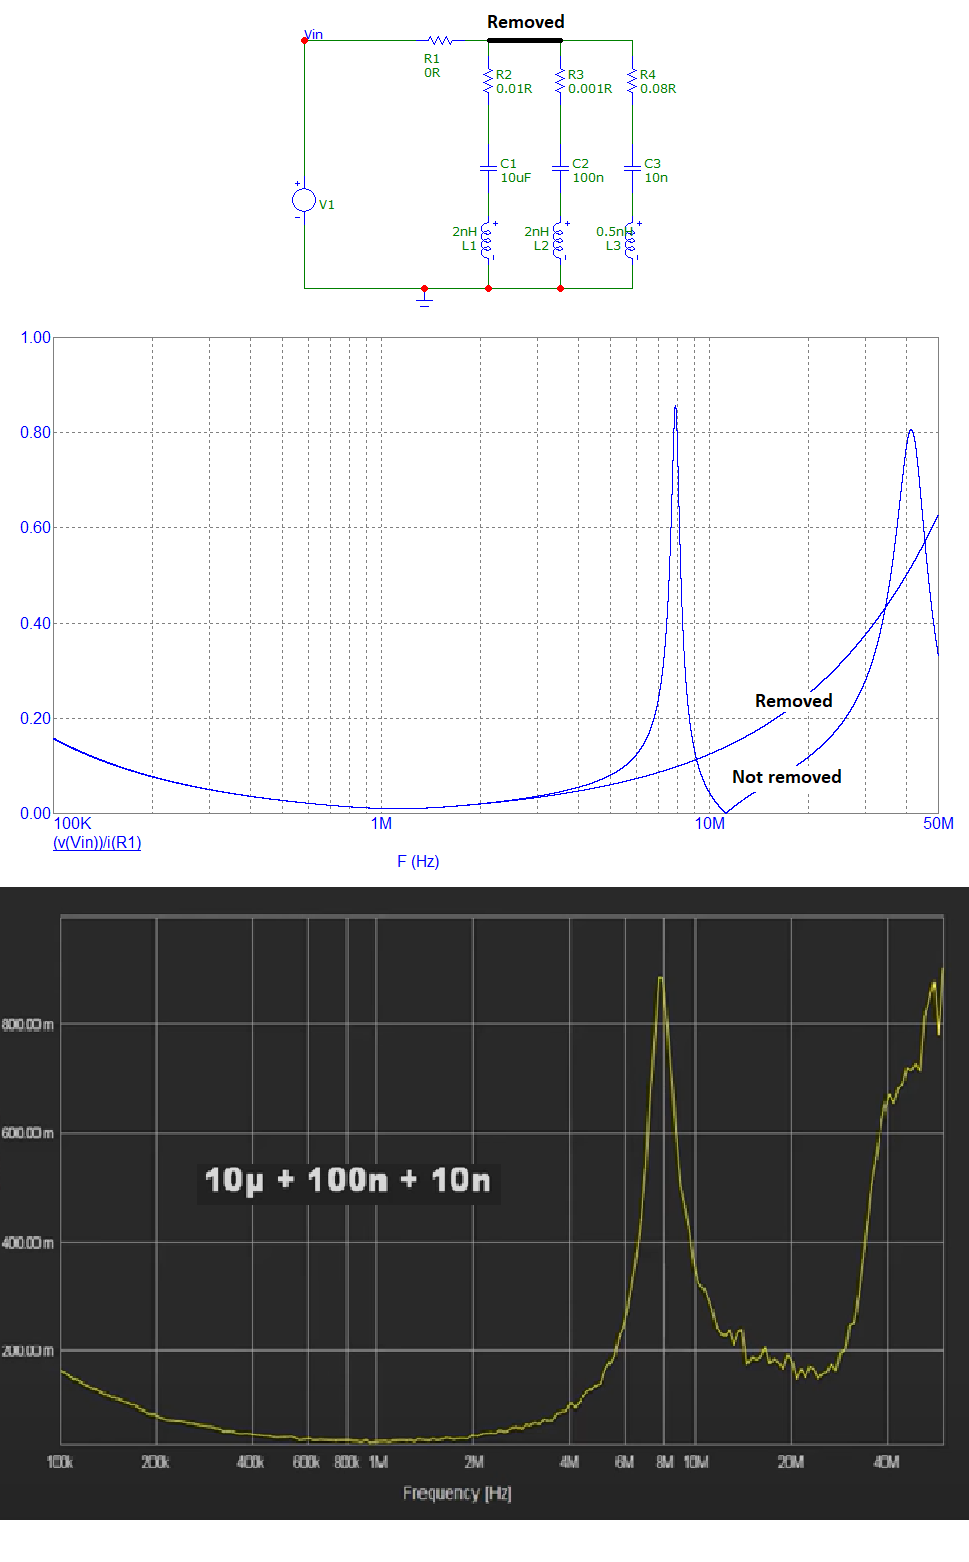
I assume that the solder blobs between capacitors introduced a series inductance that in turn caused the spike in impedance at 8MHz.
It can't be ruled out but neither can the inductance of the yellow, orange and green wires on the test set-up. I mean, where do they go and what effect do they have I wonder?
0 comment threads

0 comment threads